Am I burning fat in zone 2?
Yes. If zone 2 means easy riding below your first threshold, its upper part is usually close to where fat burning peaks. But you aren’t riding on fat. Even at its peak in a lab test, fat on its own pays for something like 100 W for a typical athlete, and less on a bike. So carbohydrate is paying a big part of the bill all ride, zone 2 included, even on an empty stomach.
The video version, 4:58, narrated by a synthetic voice. Watch on YouTube · Watch the Short
The field your screen doesn’t have
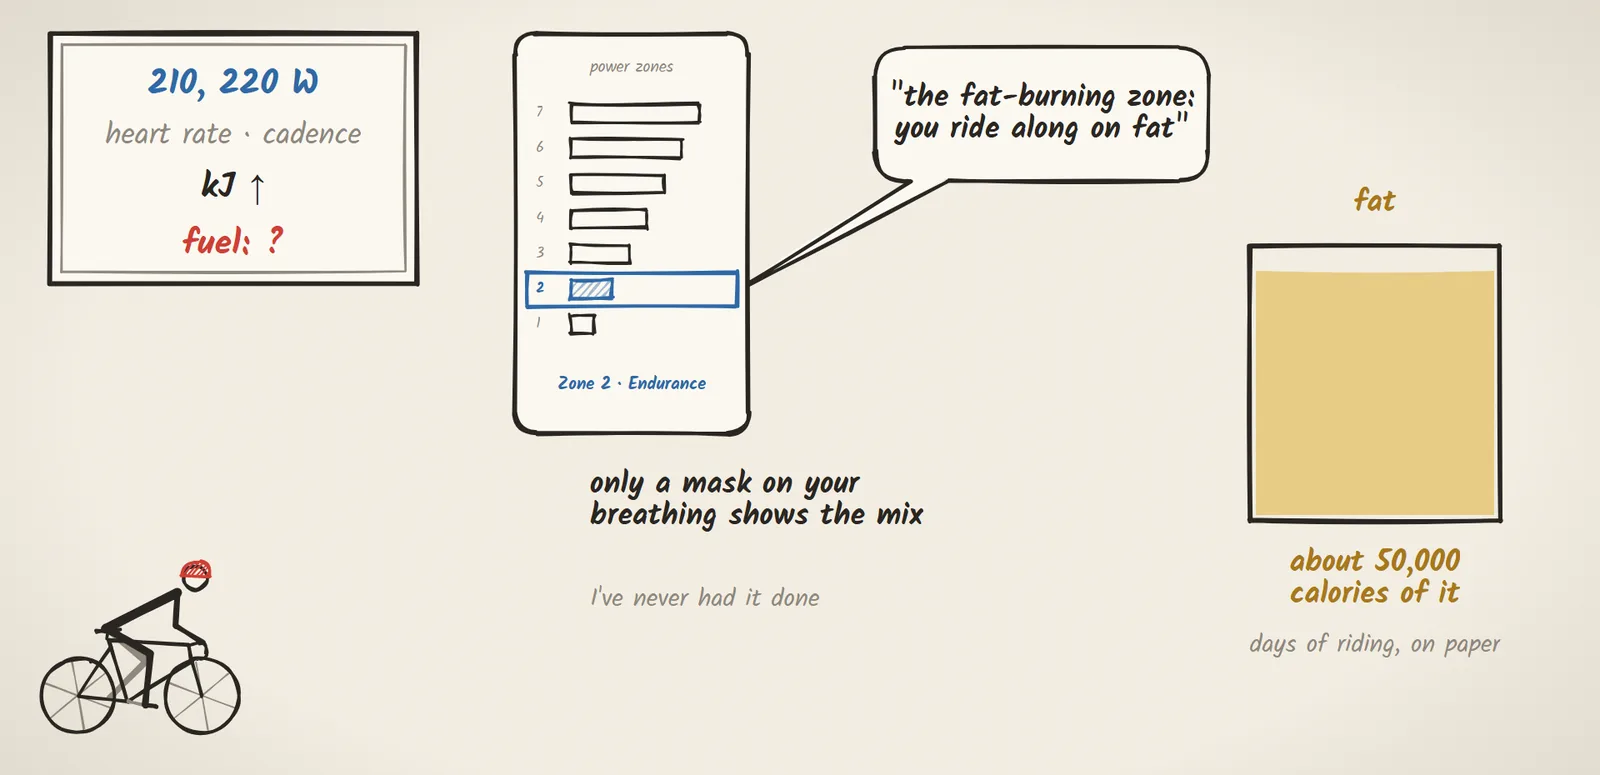
A lot of my riding is long and steady: hours on the flats at 210, 220 W, which my power zones call zone 2. My screen shows power, heart rate, cadence and the kilojoules ticking up, and not one of them says which fuel is paying. The idea that usually comes with zone 2 fills in that missing field: this is the fat-burning zone, where you ride along on fat. And the tank is certainly big enough. A lean rider carries something like 50,000 calories of fat, which on paper is days of riding. To see what’s really paying, you’d need a mask that measures your breathing. I’ve never had it done, so here’s what the measurements show.
Why fat’s pipe is thin
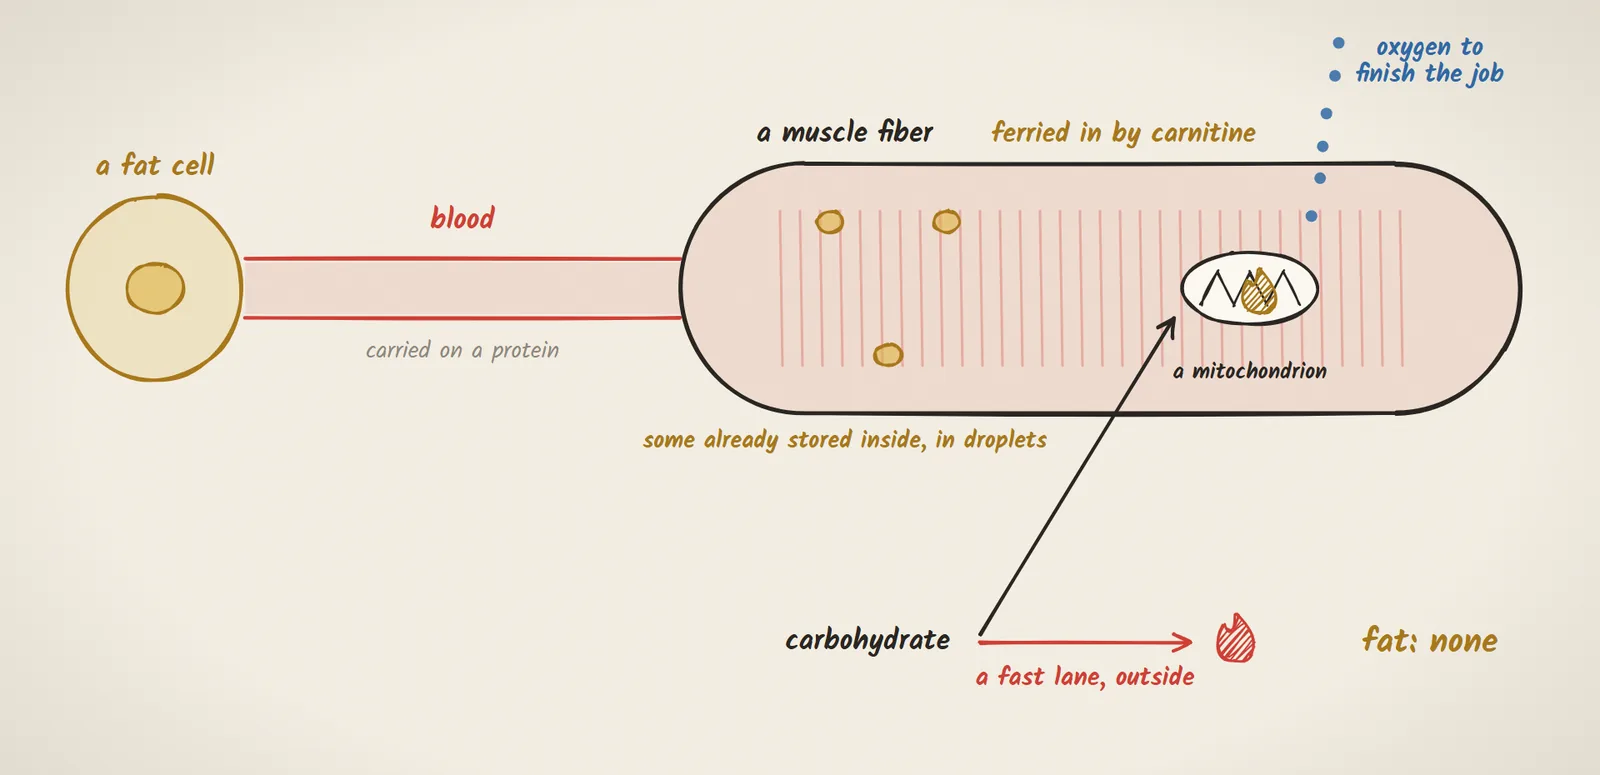
The catch is the pipe. Fat is a huge tank with a thin pipe, thin because of the route fat has to take. Much of it has to be cut loose from fat cells, carried through your blood on a protein, and handed into the muscle fiber. Some is already stored in droplets inside the fiber, which saves that trip. Either way, it then has to be ferried into the mitochondria by a carrier called carnitine. Everything after that happens inside the mitochondria, and none of it pays until there’s oxygen to finish the job. Carbohydrate gets burned in there too, but it also has a fast lane outside the mitochondria. Fat has none.
Where fat burning peaks
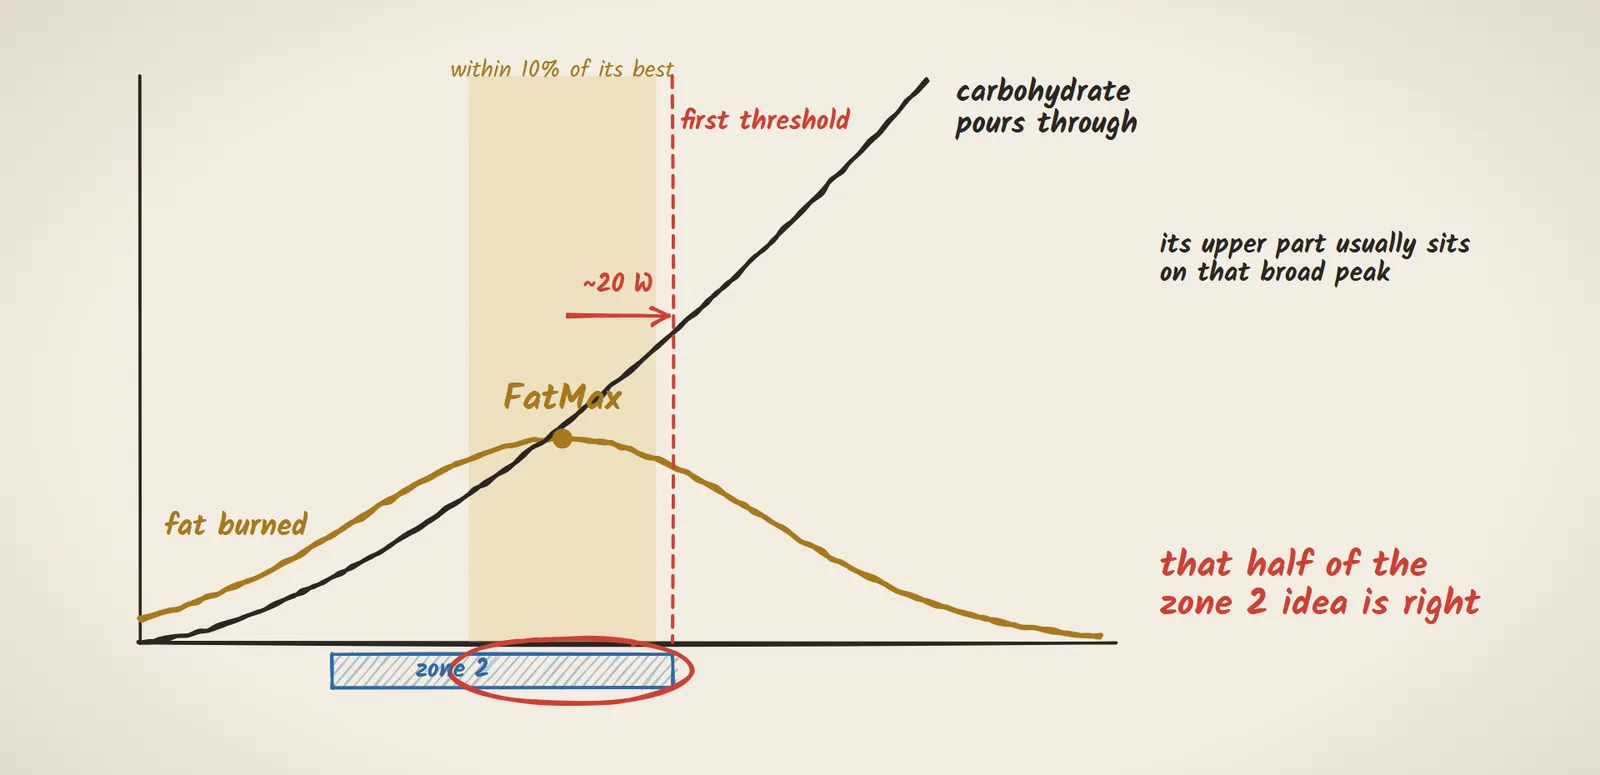
So as you ride harder, fat burning rises, reaches a peak, and then falls away: push harder still, and carbohydrate pours through while fewer fatty acids make it across. The peak has a name, FatMax. In a 2026 analysis of 42 studies, it came on average about 20 W below the first threshold, and the size of the gap depended on who was tested and how. It’s also broad. In one group of cyclists, fat burning stayed within 10% of its best from about 55 to 72% of their maximum oxygen uptake. So if zone 2 means easy riding below that first threshold, its upper part usually sits on that broad peak. That half of the zone 2 idea is right.
How big the peak is
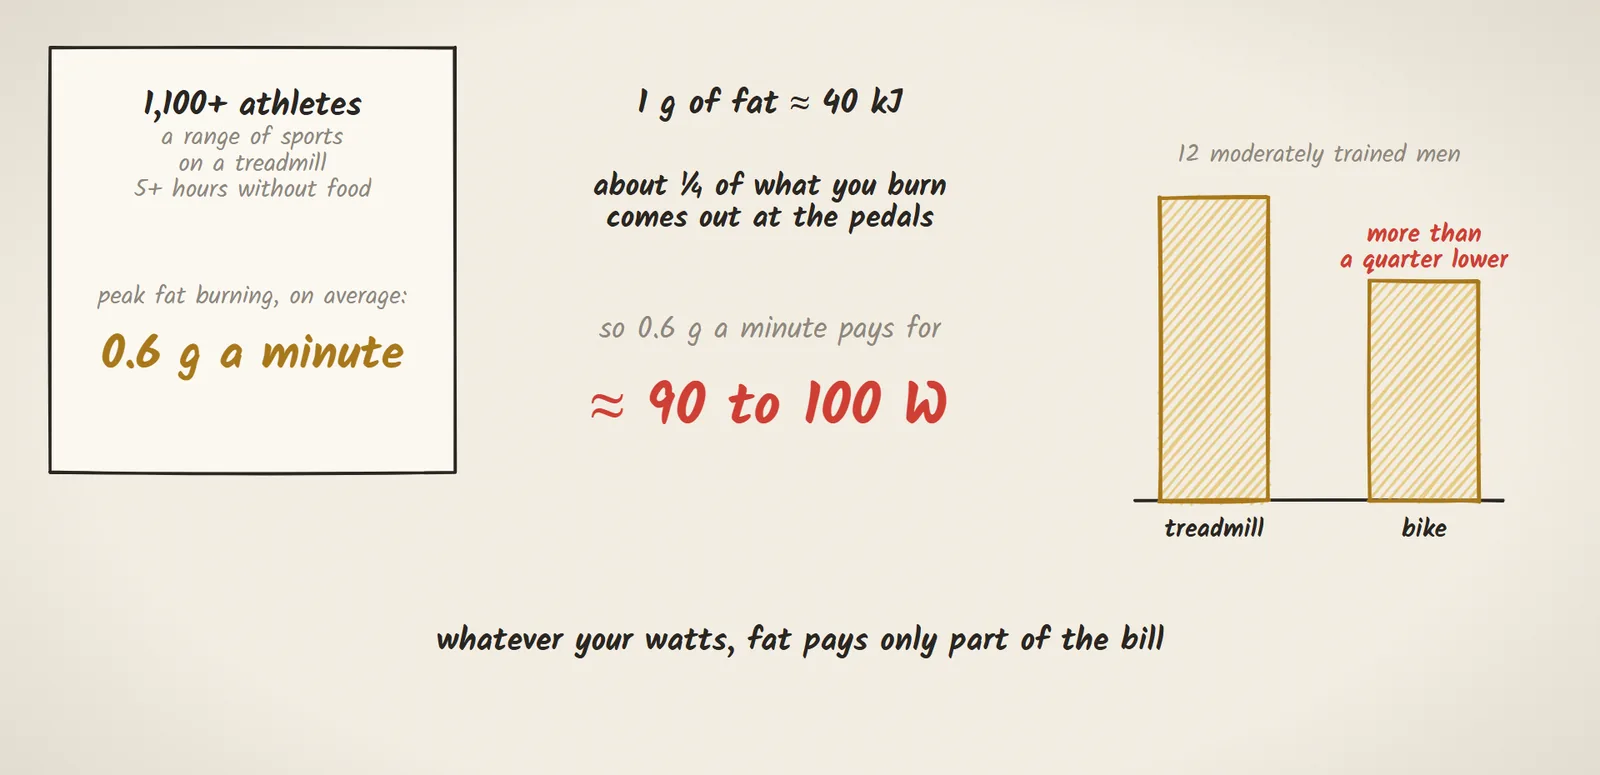
How big is the peak? Researchers pooled the tests of more than 1,100 athletes from a range of sports, on a treadmill, after at least 5 hours without food. On average, fat burning peaked at about 0.6 g a minute. A gram of fat releases about 40 kJ, and only about a quarter of the energy you burn comes out at the pedals, so 0.6 g pays for something like 90 to 100 W. On a bike, expect less: when 12 moderately trained men were tested both ways, their peak on the bike was more than a quarter lower. Those are figures from short lab tests, not fixed limits, and as the hours go by, fat’s share climbs, most of all when you aren’t eating. But whatever your watts, fat pays only part of the bill.
The experiment
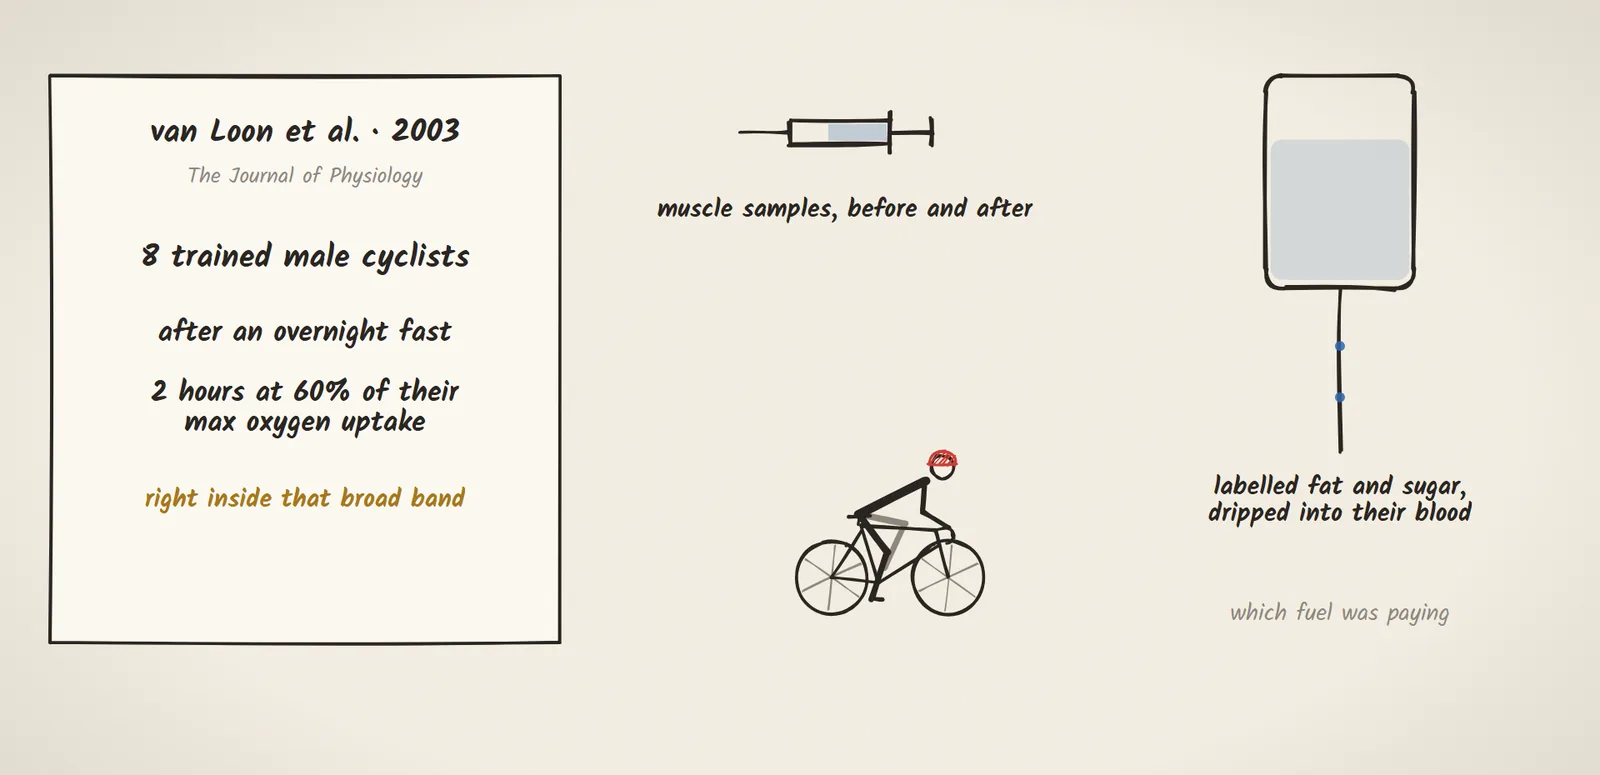
How do we know carbohydrate keeps paying, even on a ride set up to favor fat? One study did exactly that. Eight trained male cyclists came in after an overnight fast and rode for 2 hours at 60% of their maximum oxygen uptake, right inside that broad band. Labelled fat and sugar, dripped into their blood, let the researchers work out which fuel was paying, and they took muscle samples before and after.
What they found
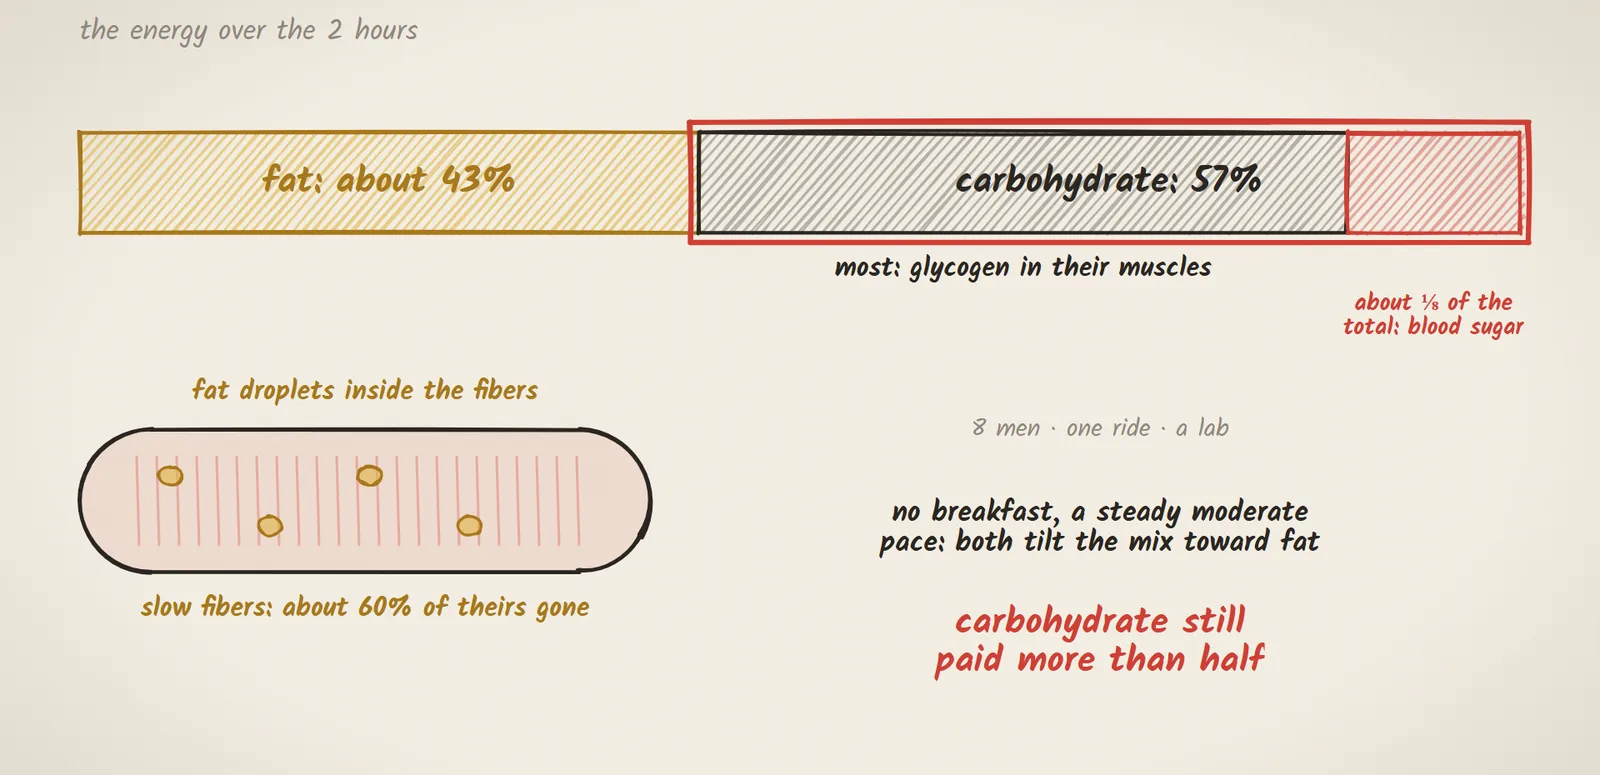
Over the 2 hours, fat paid about 43% of the energy. Carbohydrate paid the other 57, most of it from the glycogen in their muscles, and about an eighth of the total from blood sugar. Part of fat’s share came from those droplets inside the muscle fibers, and under the microscope, the slow fibers had lost about 60% of theirs. Eight men, one ride, in a lab. But skipping breakfast and holding a steady, moderate pace both tilt the mix toward fat, and carbohydrate still paid more than half.
What it means for you
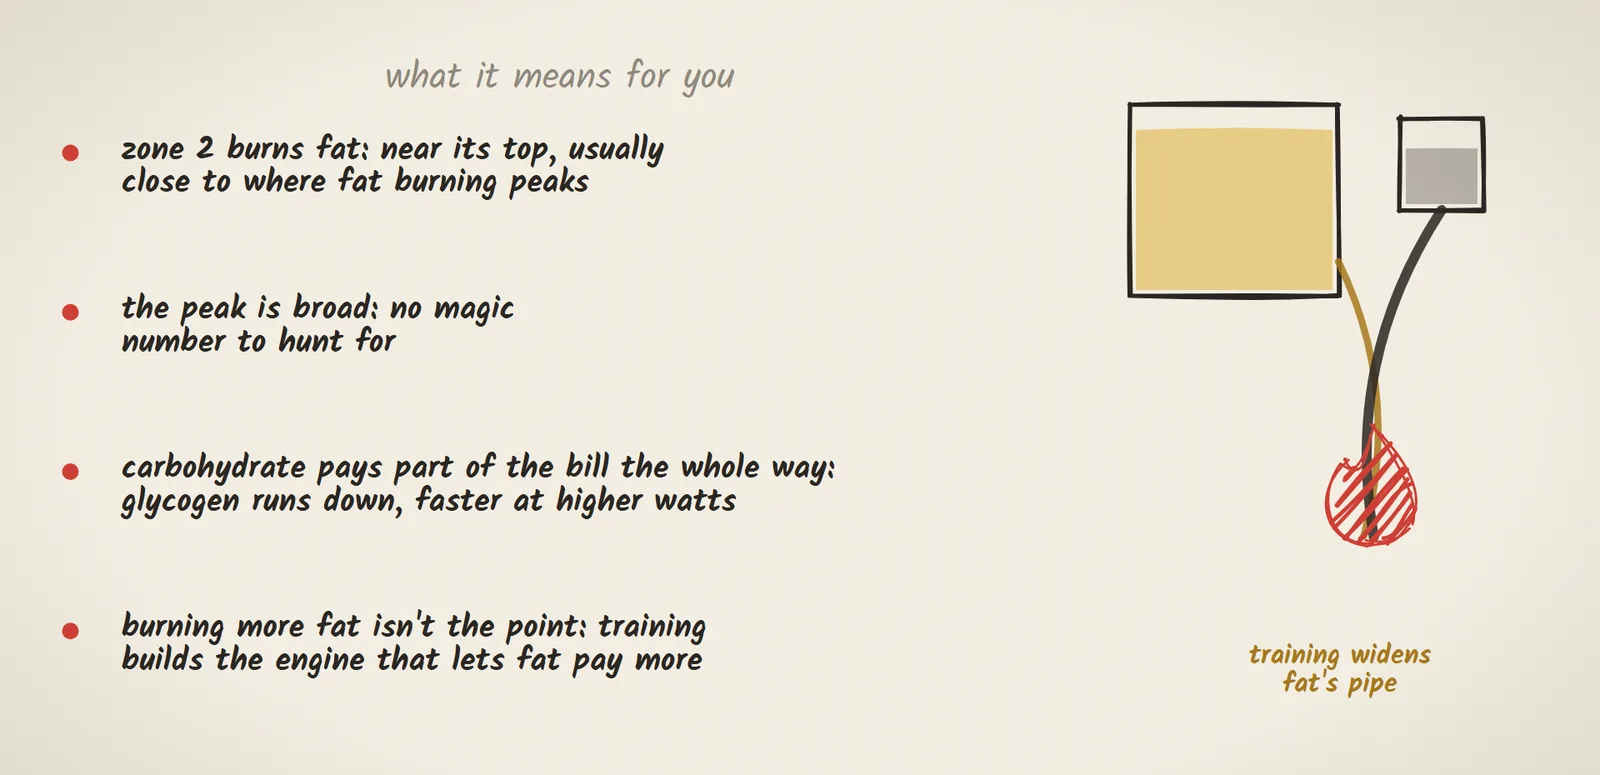
So what does this mean for you? If you ride zone 2 partly to burn fat, you are, and near its top, you’re usually close to where fat burning peaks. The peak is broad, so there’s no magic number inside it to hunt for. But carbohydrate pays part of the bill the whole way, so a long zone 2 ride runs your glycogen down as well, and the higher your zone 2 watts, the faster it goes. And burning more fat isn’t the point in itself. Training makes fat pay more at the same watts by building a bigger aerobic engine, and that’s what all those steady hours are doing.
That’s what’s underneath the watts.
Sources
The study
- van Loon LJ, Koopman R, Stegen JH, Wagenmakers AJ, Keizer HA, Saris WH. Intramyocellular lipids form an important substrate source during moderate intensity exercise in endurance-trained males in a fasted state. J Physiol. 2003;553(Pt 2):611-625. doi.org/10.1113/jphysiol.2003.052431
Also in this article
- How big the peak is, in 1,121 athletes: Randell RK, Rollo I, Roberts TJ, Dalrymple KJ, Jeukendrup AE, Carter JM. Maximal fat oxidation rates in an athletic population. Med Sci Sports Exerc. 2017;49(1):133-140. doi.org/10.1249/MSS.0000000000001084
- Lower on a bike than on a treadmill: Achten J, Venables MC, Jeukendrup AE. Fat oxidation rates are higher during running compared with cycling over a wide range of intensities. Metabolism. 2003;52(6):747-752. doi.org/10.1016/S0026-0495(03)00068-4
- The broad peak: Achten J, Gleeson M, Jeukendrup AE. Determination of the exercise intensity that elicits maximal fat oxidation. Med Sci Sports Exerc. 2002;34(1):92-97. doi.org/10.1097/00005768-200201000-00015
- Where the peak sits against the first threshold: Hogan C, Cross TJ, Tiong M, Pratheepan P, Blaxland A, Machan E, Rooney K. The agreement between Fatmax and the gas-exchange and blood lactate thresholds: a systematic review and meta-analysis. Med Sci Sports Exerc. 2026;58(9):2145-2162. doi.org/10.1249/MSS.0000000000004027
Written and researched by Yarin Podoler, a cyclist who wanted to know what’s underneath the watts.