Can a lactate test make me look fitter than I am?
Yes, if your muscles are low on glycogen when you take it. Your lactate can read lower at the same watts, and your curve can look the way it does after a good block of training, even though your fitness hasn’t improved.
The video version, 4:24, narrated by a synthetic voice. Watch on YouTube · Watch the Short
The test that came back better
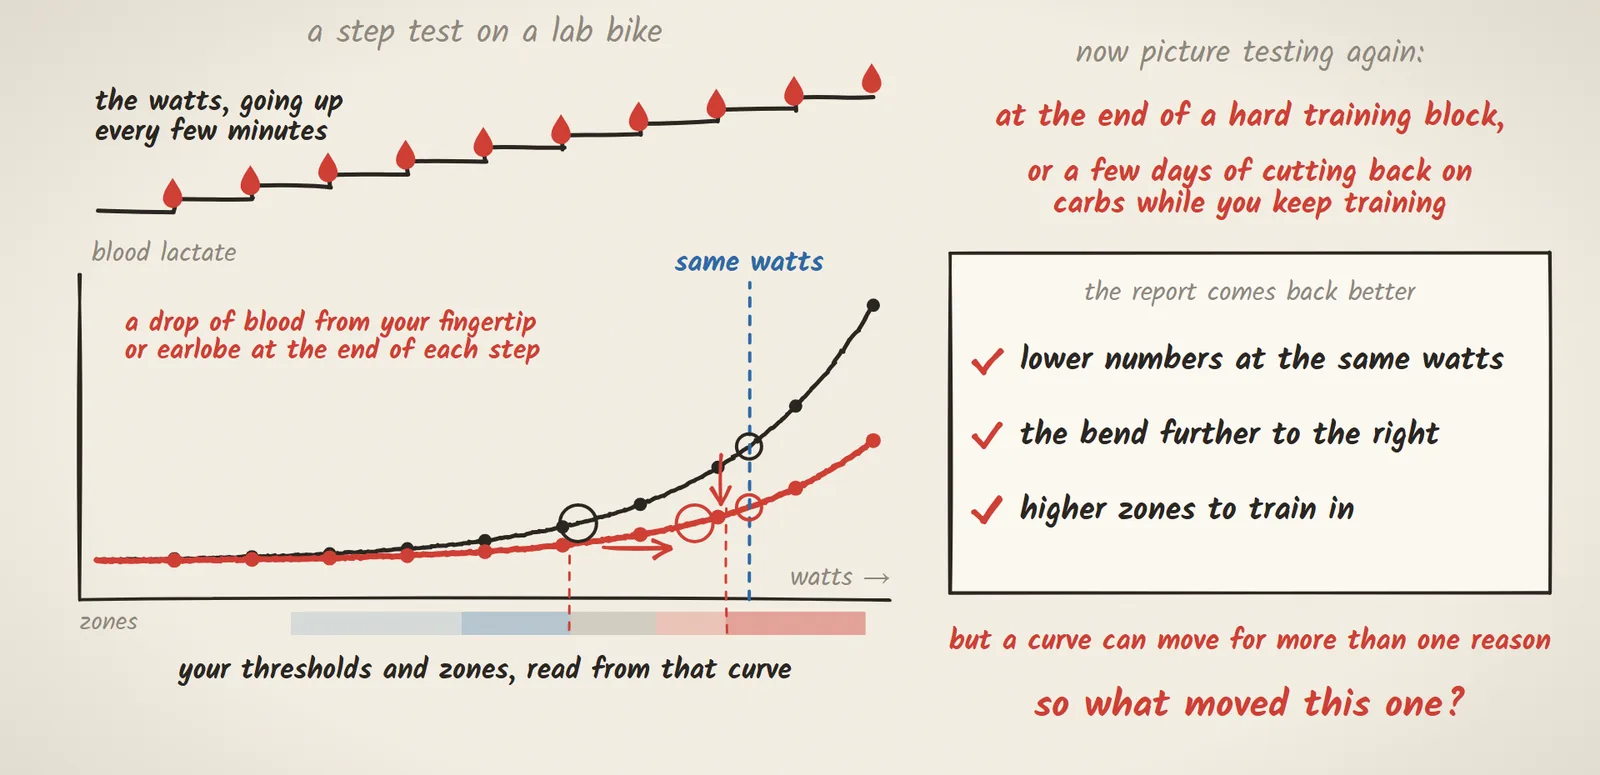
Maybe you’ve done one: a step test on a lab bike, the watts going up every few minutes, and a drop of blood from your fingertip or earlobe at the end of each step. The numbers stay low for a while and then bend upward, and your thresholds and zones are read from that curve. Now picture testing again at the end of a hard training block, or after a few days of cutting back on carbs while you keep training. The report comes back better: lower numbers at the same watts, the bend further to the right, and higher zones to train in. It looks like a breakthrough. But a curve can move for more than one reason, so what moved this one?
Where the lactate comes from
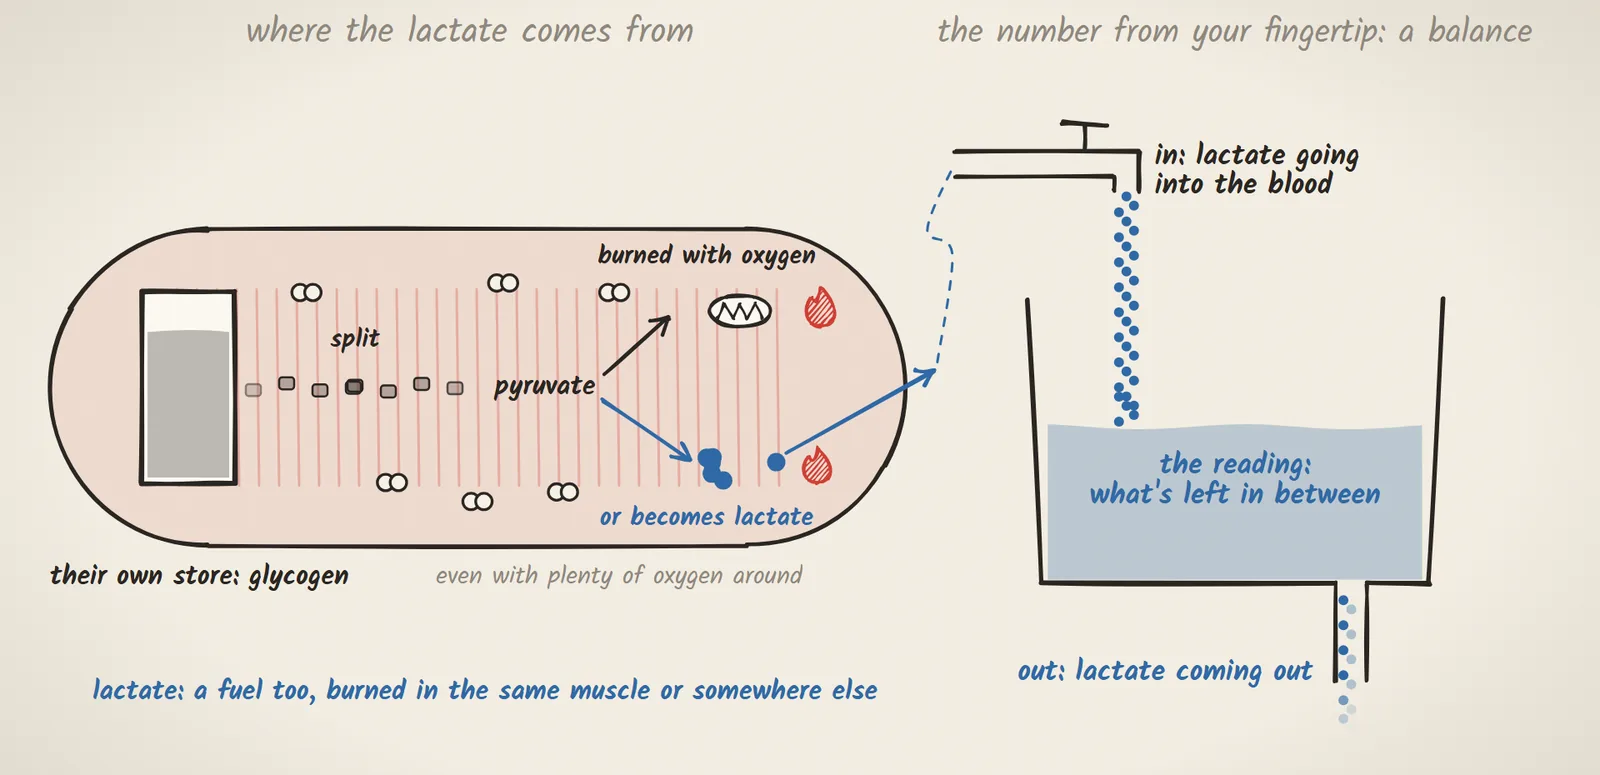
Start with where the lactate comes from. On a hard step, your muscles get much of their energy by splitting carbohydrate, and most of that carbohydrate comes from their own store, glycogen. Splitting it makes pyruvate, and some of that goes into the mitochondria to be burned with oxygen while some becomes lactate, even with plenty of oxygen around. Lactate is a fuel too, burned in the same muscle or somewhere else. So the number from your fingertip is a balance, like the water in a bath with the tap running and the drain open: lactate going into the blood, lactate coming out, and the reading is what’s left in between.
A test started with the store run down
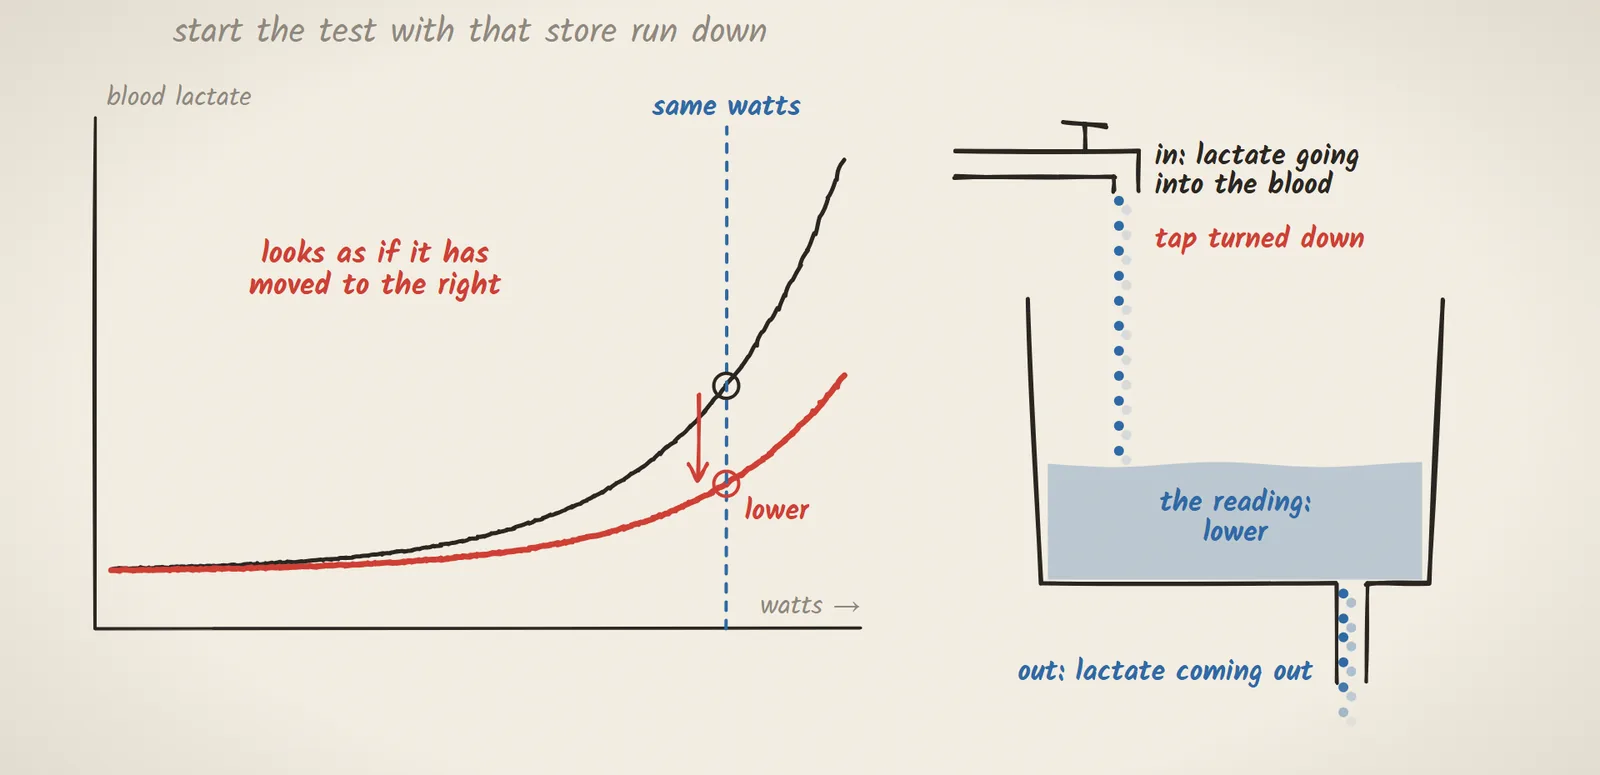
Now start the test with that store run down. With less glycogen in it, the muscle breaks glycogen down more slowly and leans more on fat. Less carbohydrate split means less pyruvate, and less lactate made. The tap has been turned down, so at the same watts the reading comes out lower, and the curve looks as if it has moved to the right.
A bigger engine, or an emptier tank
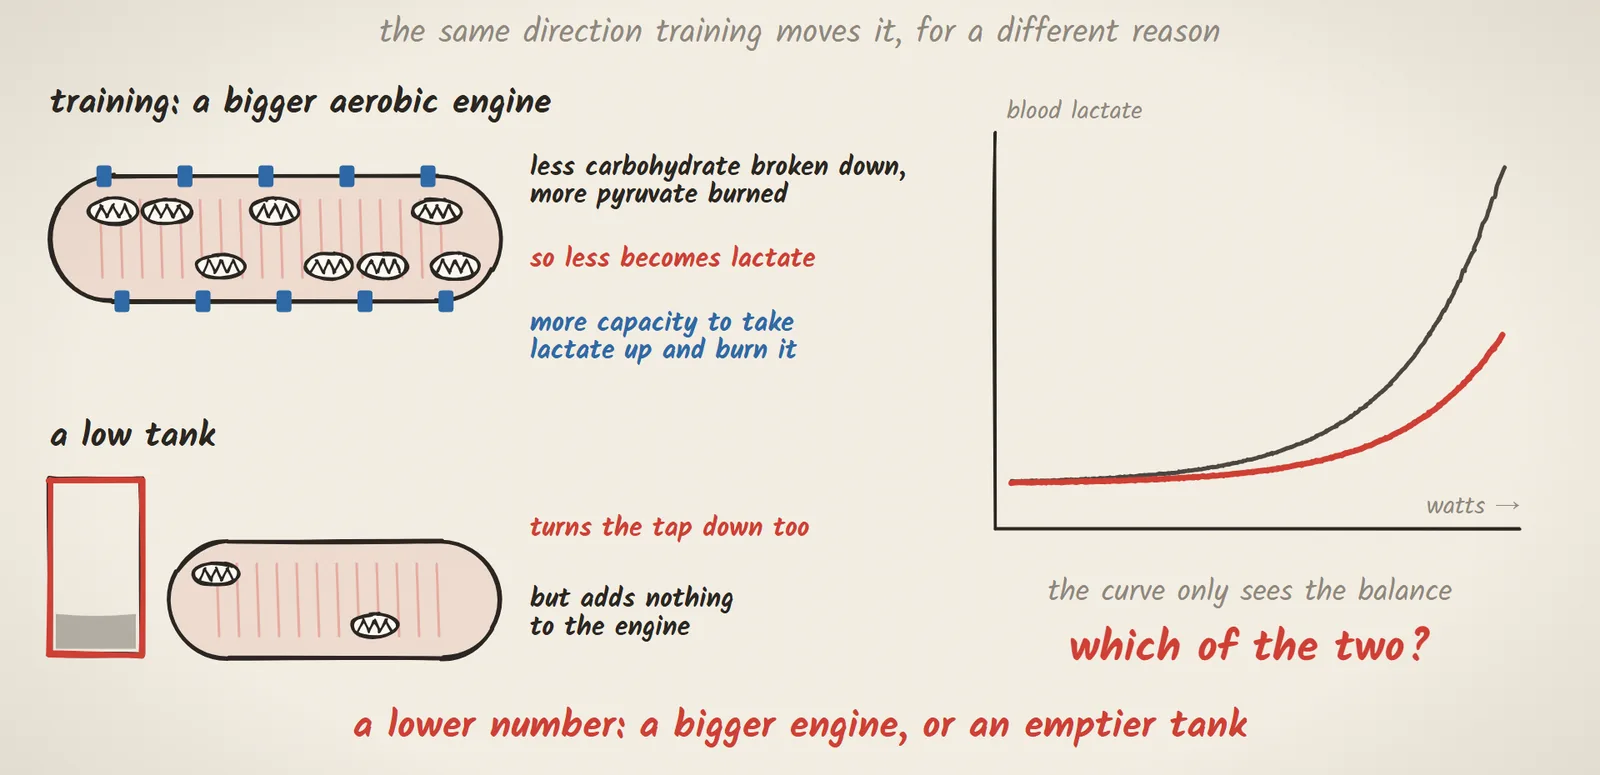
That’s the same direction training moves it, for a different reason. Training builds a bigger aerobic engine, with more mitochondria. At the same watts, a trained muscle breaks down less carbohydrate and burns more of the pyruvate it makes, so less of it becomes lactate, and it has more capacity to take lactate up and burn it. A low tank turns the tap down too, but without adding anything to the engine. And the curve only sees the balance, so it can’t tell you which of the two happened. A lower number can mean a bigger engine, or an emptier tank.
The experiment
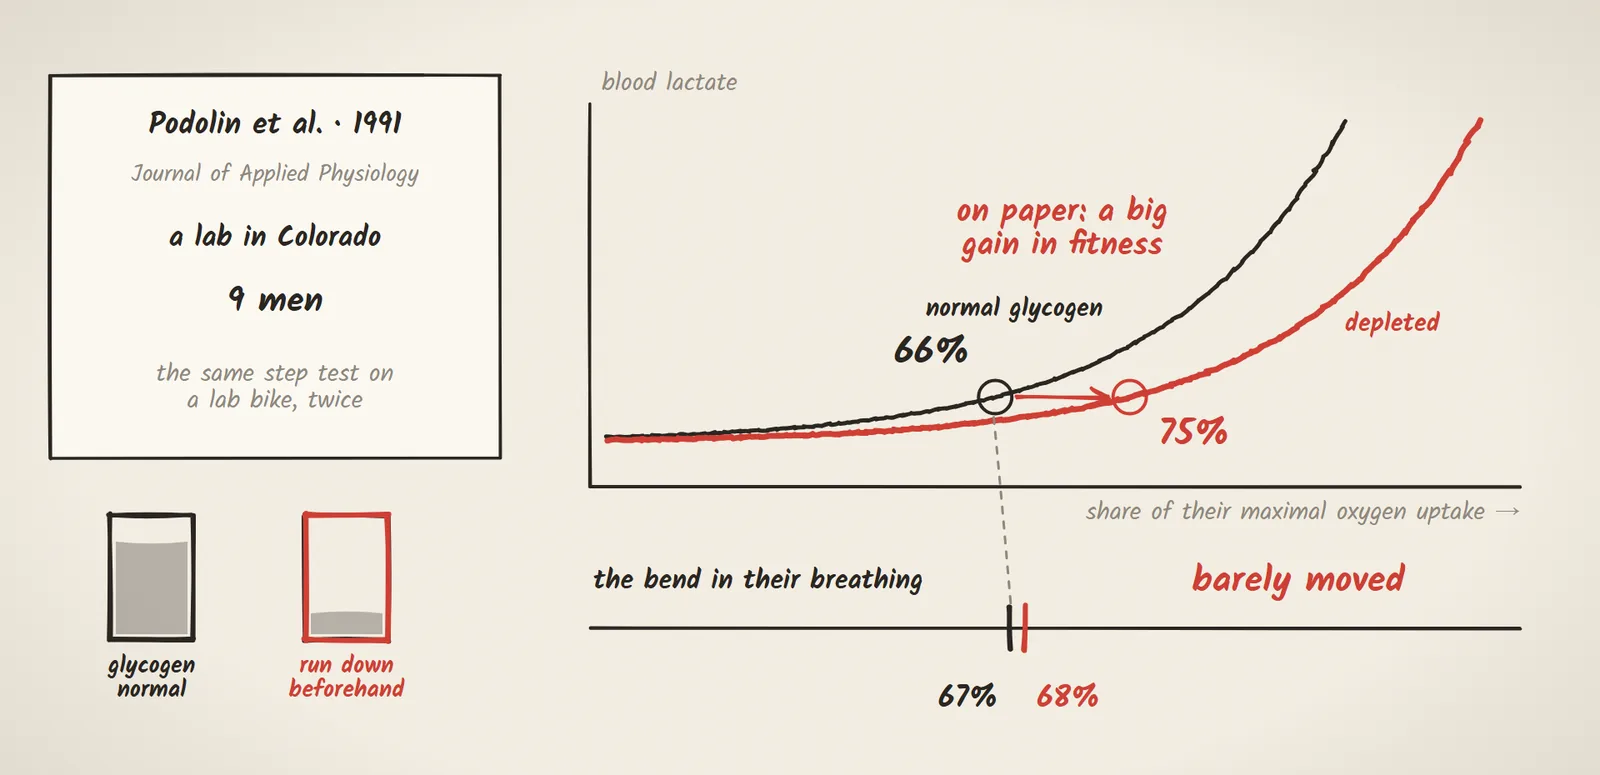
How do we know? In 1991, a lab in Colorado had 9 men do the same step test on a lab bike twice: once with their muscle glycogen at its normal level, and once with it deliberately run down beforehand. With normal glycogen, the bend in their lactate curve came at about 66% of their maximal oxygen uptake. Depleted, it came at a higher workload, at about 75. On paper, that would look like a big gain in fitness. But the bend in their breathing, which in the normal test had come at almost the same place, barely moved: about 67%, then 68.
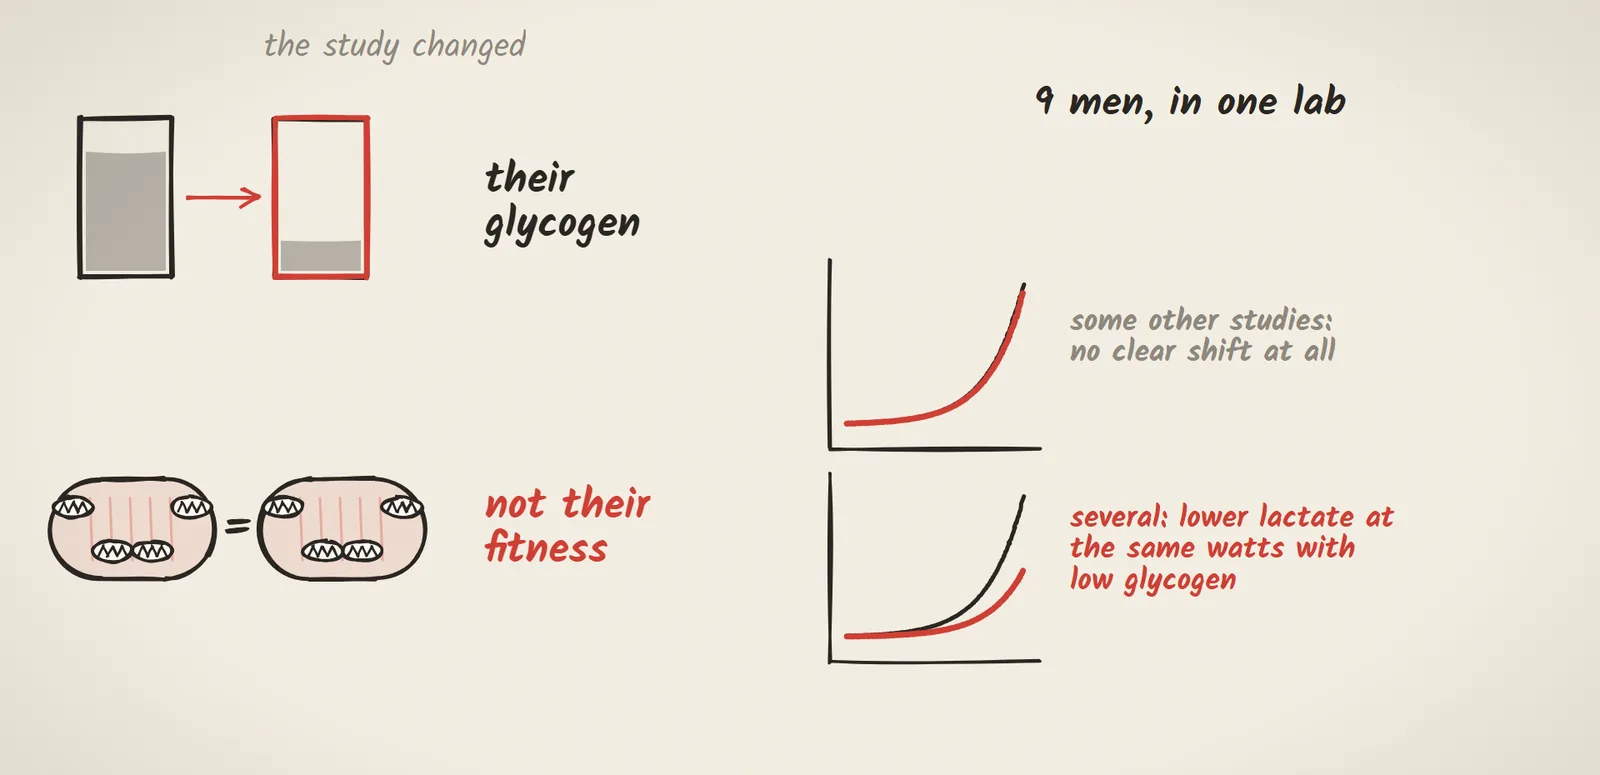
The study changed their glycogen, not their fitness. That was 9 men in one lab, and some other studies found no clear shift at all, but several have found lower lactate at the same watts with low glycogen.
What it means for you
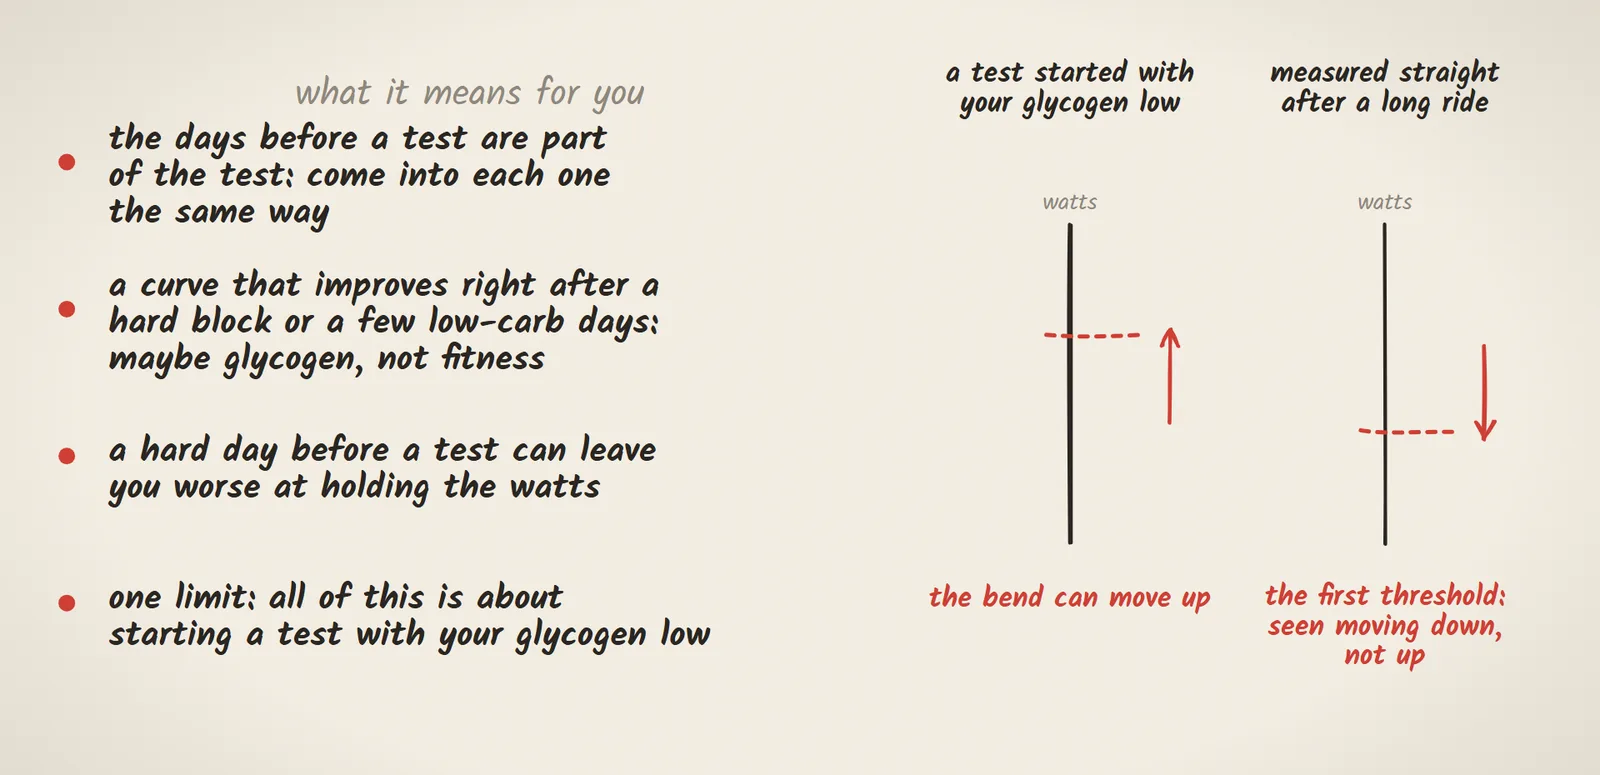
So what does this mean for you? If you get tested, the days before the test are part of the test. Come into each one the same way, with the same kind of training and the same eating in the days before, so the curve is comparing your fitness, not your tank. If a curve improves right after a hard block or a few low-carb days, it may be glycogen, not fitness. And a hard day before a test can leave you worse at holding the watts. In one study of 10 riders, a hard session the evening before cut how long they could hold the same hard, steady power by about a third, even with plenty of carbohydrate afterwards, and by nearly two-thirds without it. Yet without it, at the same point in the ride, their lactate read about half as high as when they were rested. One limit: all of this is about starting a test with your glycogen low. Measured straight after a long ride, the first threshold has been seen moving down, not up.
That’s what’s underneath the watts.
Sources
The study
- Podolin DA, Munger PA, Mazzeo RS. Plasma catecholamine and lactate response during graded exercise with varied glycogen conditions. J Appl Physiol. 1991;71(4):1427-1433. doi.org/10.1152/jappl.1991.71.4.1427
Also in this article
- A hard session the evening before cut how long 10 riders could hold the same steady power by about a third with carbohydrate afterwards and by nearly two-thirds without it, while their lactate read lower: Quinn CP, McDougall RM, Aboodarda SJ, Murias JM, MacInnis MJ. Effects of carbohydrate availability on cycling endurance at the maximal lactate steady state. Am J Physiol Regul Integr Comp Physiol. 2024;326(3):R266-R275. doi.org/10.1152/ajpregu.00178.2023
- Measured straight after two hours of riding, fasted and on water only, the first threshold moved down, not up (14 trained cyclists and triathletes): Stevenson JD, Kilding AE, Plews DJ, Maunder E. Prolonged cycling reduces power output at the moderate-to-heavy intensity transition. Eur J Appl Physiol. 2022;122(12):2673-2682. doi.org/10.1007/s00421-022-05036-9
- Low glycogen has lowered lactate in a graded test in several studies, though not in all, and that can be mistaken for the effect of training (a review): Benítez-Muñoz JA, Cupeiro R. Factors influencing blood lactate concentration during exercise: a narrative review with a lactate shuttle perspective. Acta Physiol (Oxf). 2025;241(12):e70131. doi.org/10.1111/apha.70131
Written and researched by Yarin Podoler, a cyclist who wanted to know what’s underneath the watts.