What is zone 2, really? Why do my apps disagree?
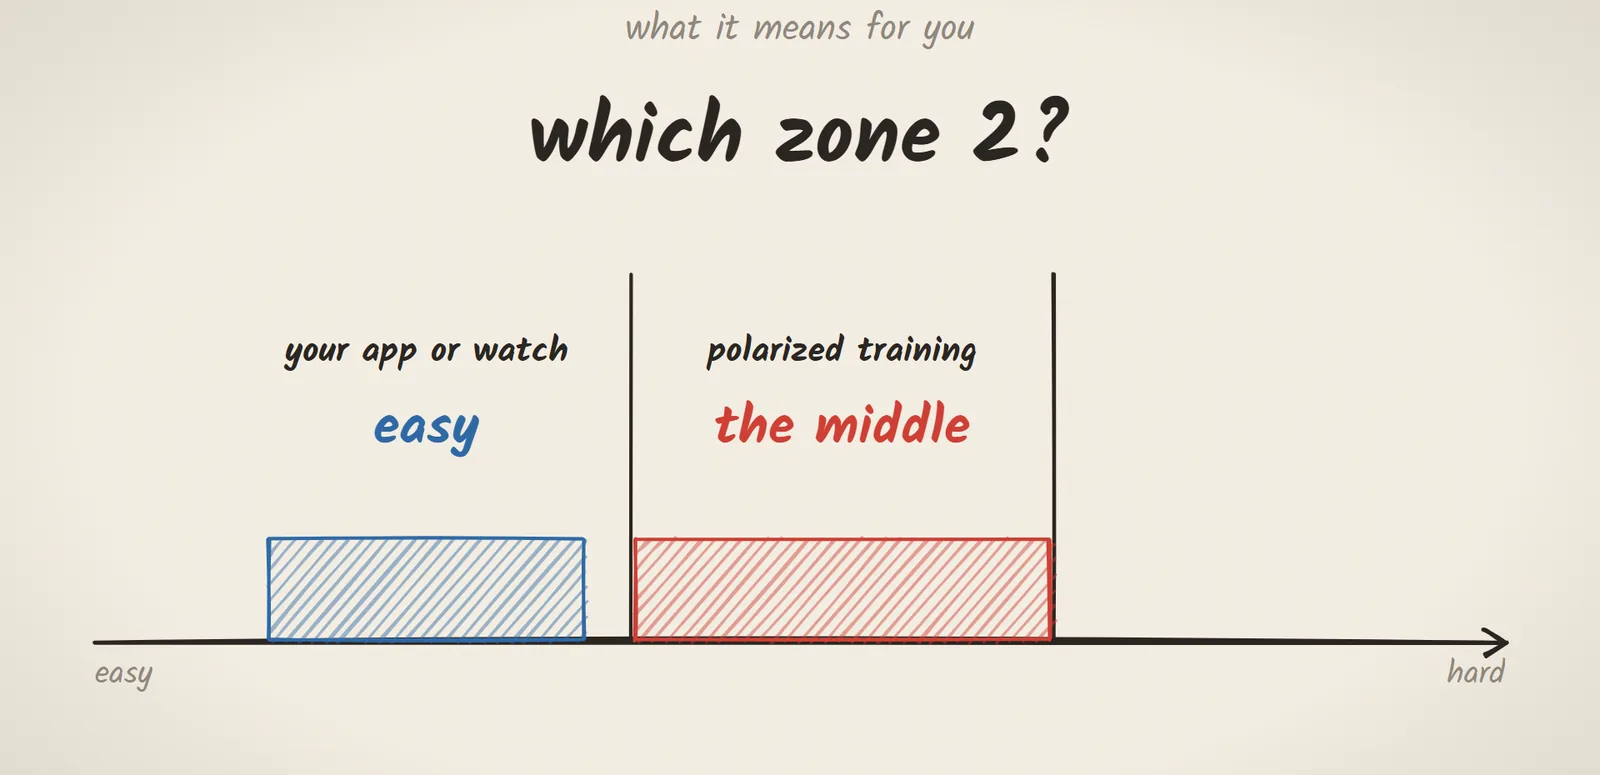
Because zone 2 means different things in different zone systems. In most of them, it’s easy endurance riding. In the three-zone system behind polarized training, it’s the harder middle ground, the zone polarized training tells you to keep to a minimum.
The video version, 4:16, narrated by a synthetic voice. Watch on YouTube · Watch the Short
Three sources, one word
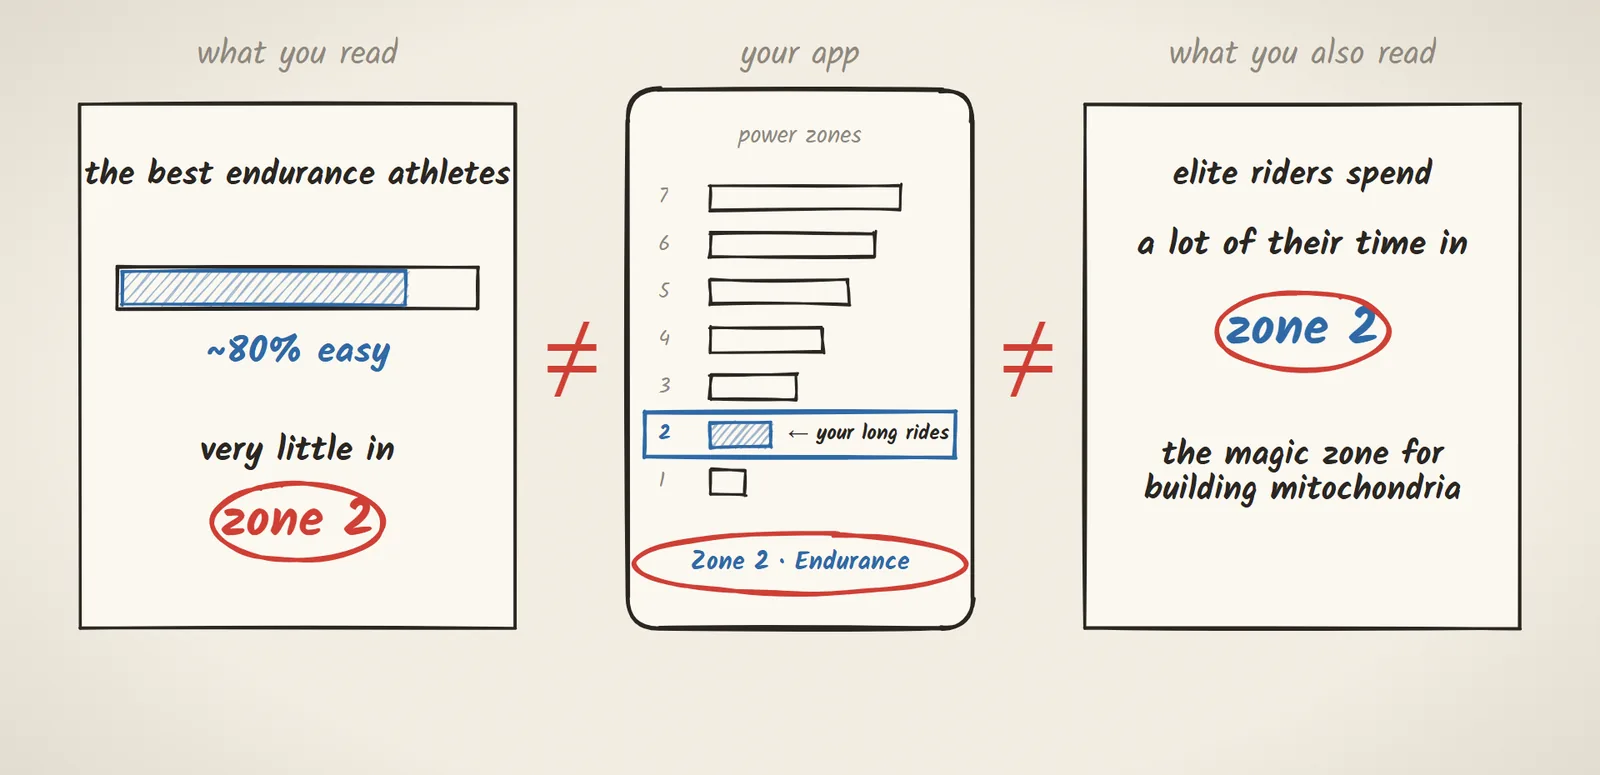
Here’s how the confusion usually arrives. You read that the best endurance athletes do about 80% of their training easy, and very little in zone 2. Then you open your training app, and zone 2 is labelled endurance and covers exactly the power you do your long rides at. Meanwhile, you read somewhere else that elite riders spend a lot of their time in zone 2, and that it’s the magic zone for building mitochondria. Three sources, one word, and they can’t all mean the same thing.
Your body’s two transitions
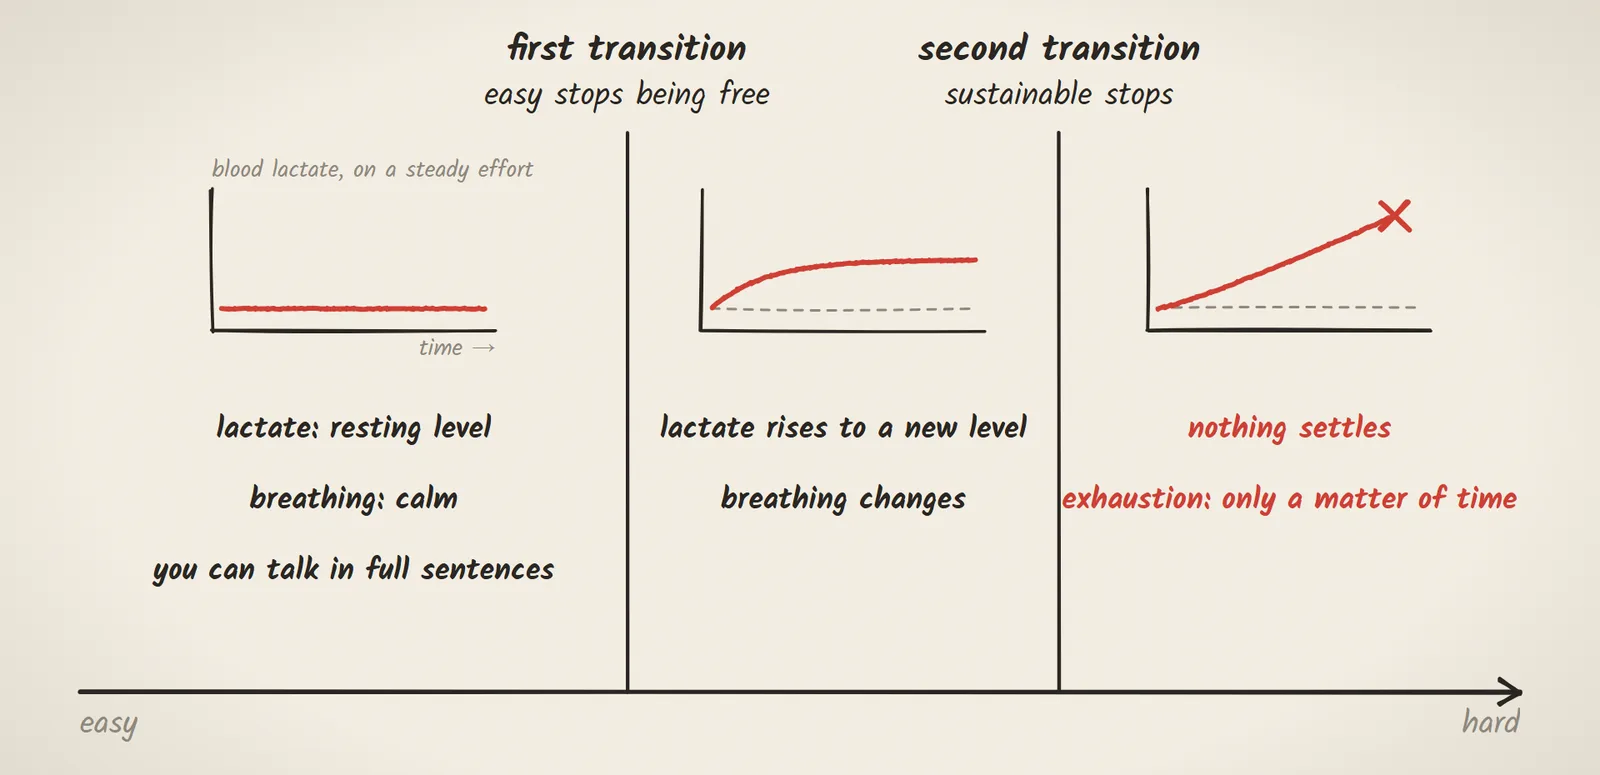
Underneath every zone chart there are really only two transitions in your body. The first is where easy stops being free. Below it, blood lactate sits at its resting level, your breathing is calm, and you can talk in full sentences. Above it, lactate rises to a new level and your breathing changes. The second is where sustainable stops being available at all: above it, nothing settles, and exhaustion is only a matter of time.
Zones as percentages
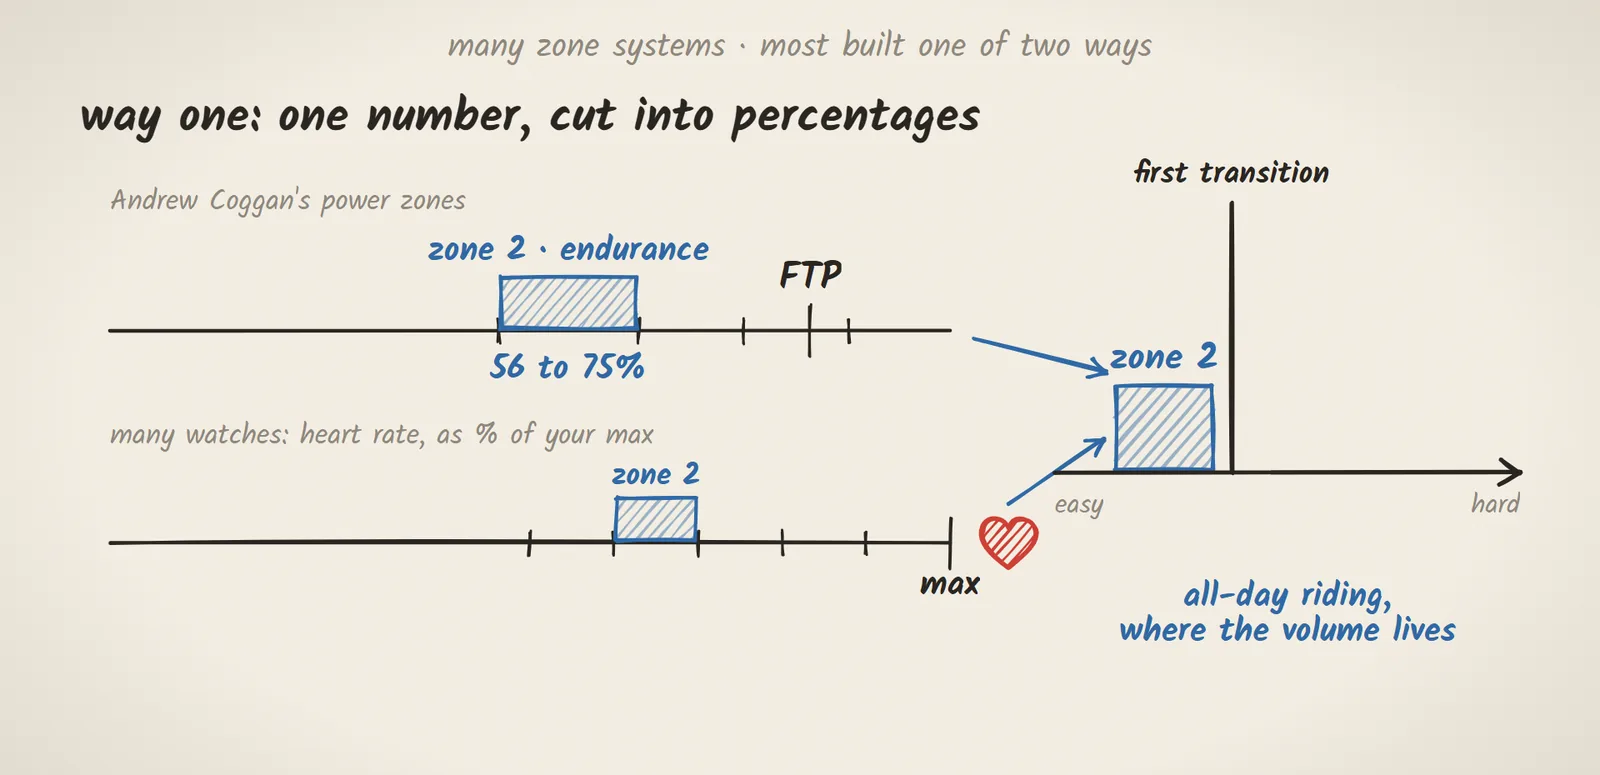
There are many zone systems, but most are built in one of two ways. The first takes a single number and cuts it into percentages. The power zones in most training software come from Andrew Coggan’s work, as percentages of FTP, and zone 2, endurance, is 56 to 75%. Many watches do the same with heart rate, as percentages of your maximum. Either way, zone 2 is meant to sit below that first transition: all-day riding, where the volume lives.
Zones from the transitions
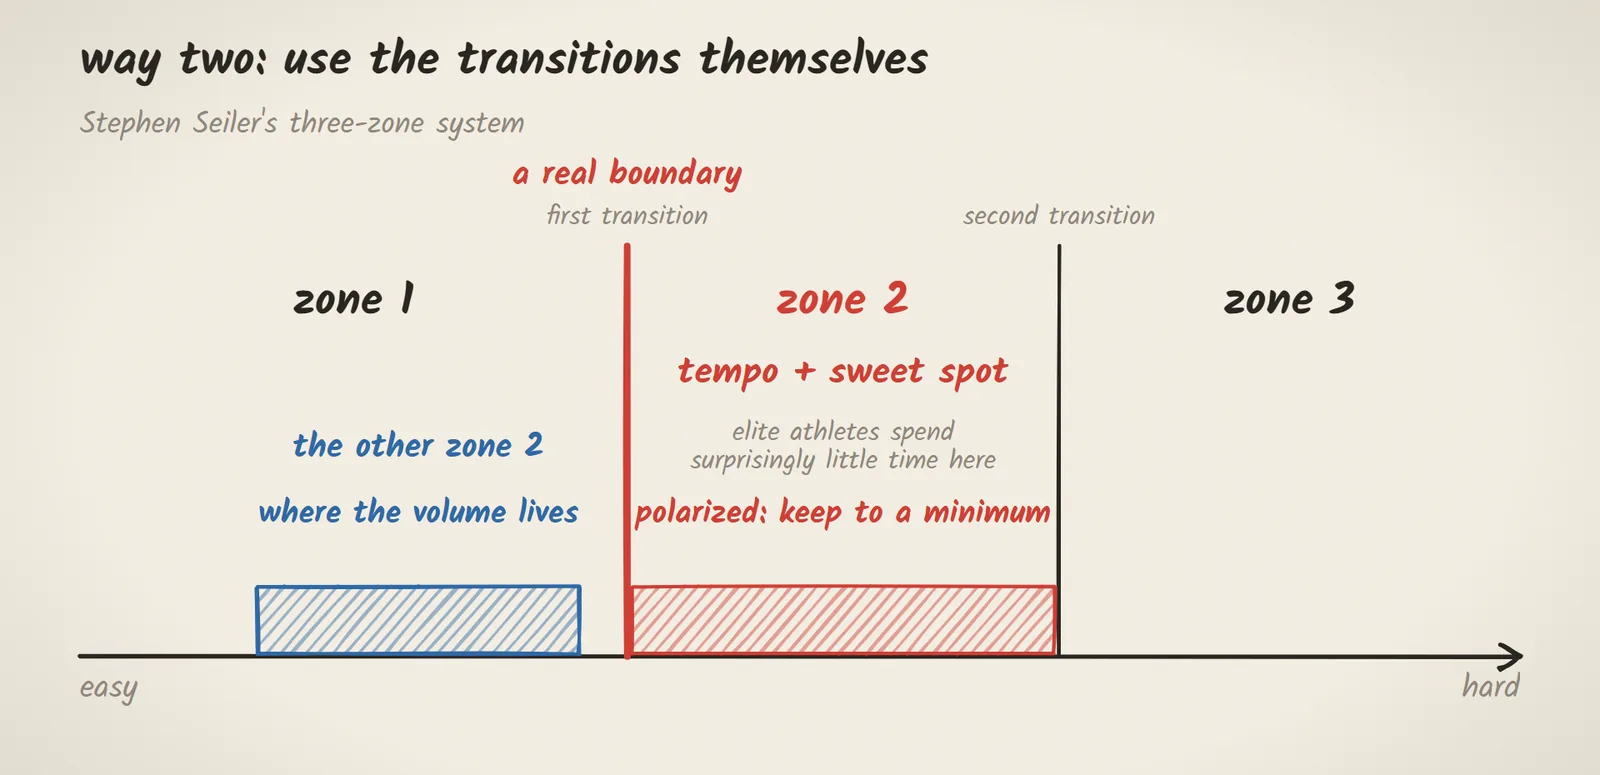
The second way skips the percentages and uses the two transitions themselves. In the three-zone system from the physiologist Stephen Seiler, zone 1 is below the first transition, zone 2 is between them, and zone 3 is above the second. So Seiler’s zone 2 is tempo and sweet spot. It’s the band that elite endurance athletes were found to spend surprisingly little time in, and the one polarized training tells you to keep to a minimum. The two zone 2s sit on opposite sides of a real boundary, with opposite advice attached.
The deeper problem
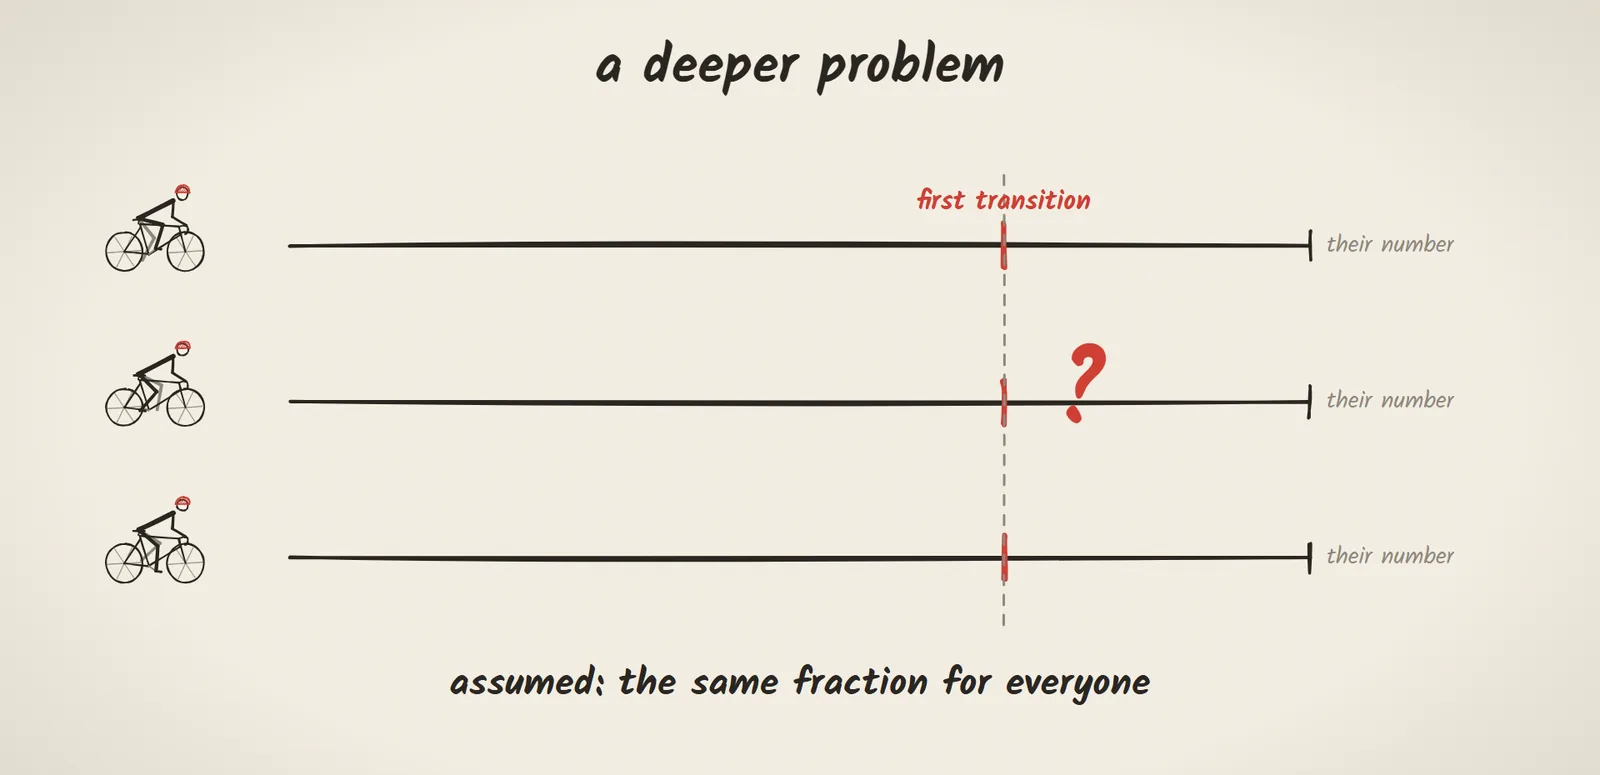
And even if everyone agreed which zone 2 they meant, the percentage systems have a deeper problem. They assume your first transition sits at the same fraction of that single number for everyone.
The experiment
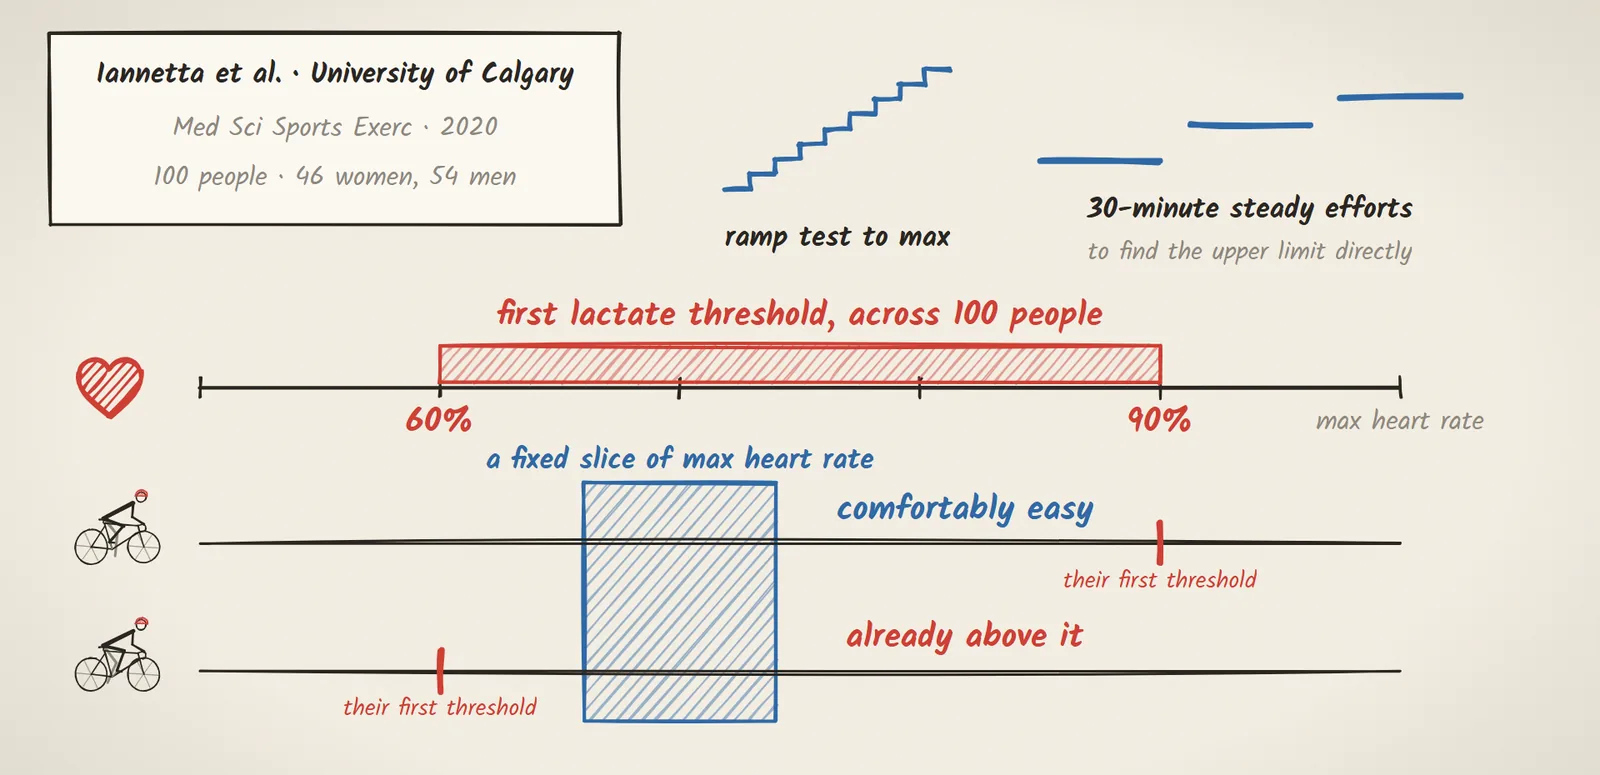
For heart rate, that assumption has been tested. In 2020, a group in Calgary tested 100 people, 46 women and 54 men. Each did a ramp test to their maximum, and then a series of 30-minute steady efforts to find their upper limit directly. Their first lactate threshold landed anywhere from 60 to 90% of their maximum heart rate. So the same fixed slice of maximum heart rate put some of them comfortably in easy riding and others already above it.
What it means for you
So what does this mean for you? First, when someone says zone 2, ask which one. If they mean polarized training, they mean the middle. If they mean your app or your watch, they mean easy.
Check your chart against your body
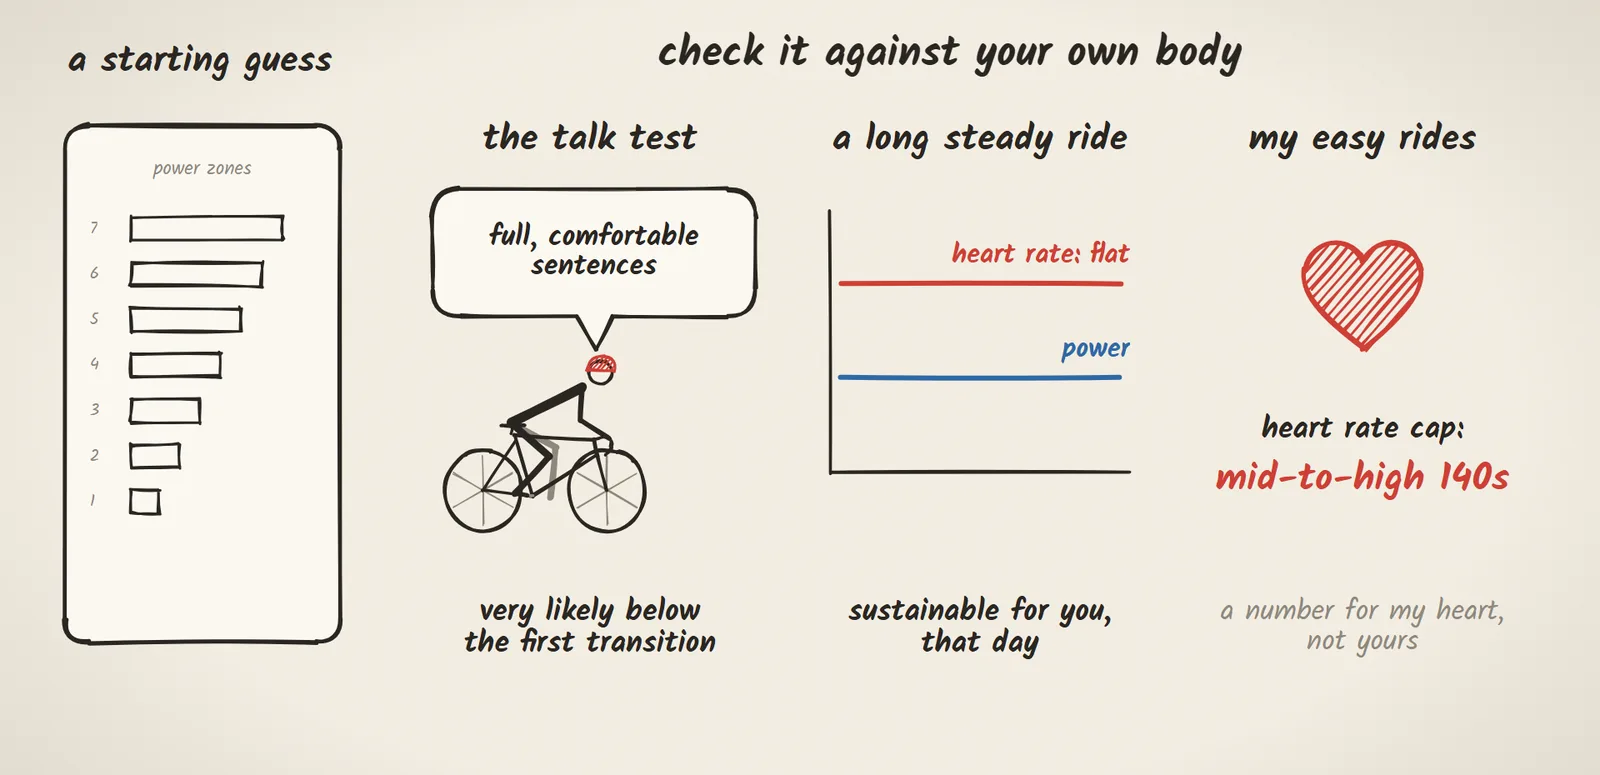
Second, treat your zone chart as a starting guess, and check it against something that responds to your own body. The simplest is the talk test: if you can still speak in full, comfortable sentences, you’re very likely below that first transition. On a long steady ride, a heart rate that stays flat against your power is good evidence the effort is sustainable for you, that day. For my own easy rides, a heart rate cap somewhere in the mid-to-high 140s has worked well, but that’s a number for my heart, not yours.
When the chart is wrong for you
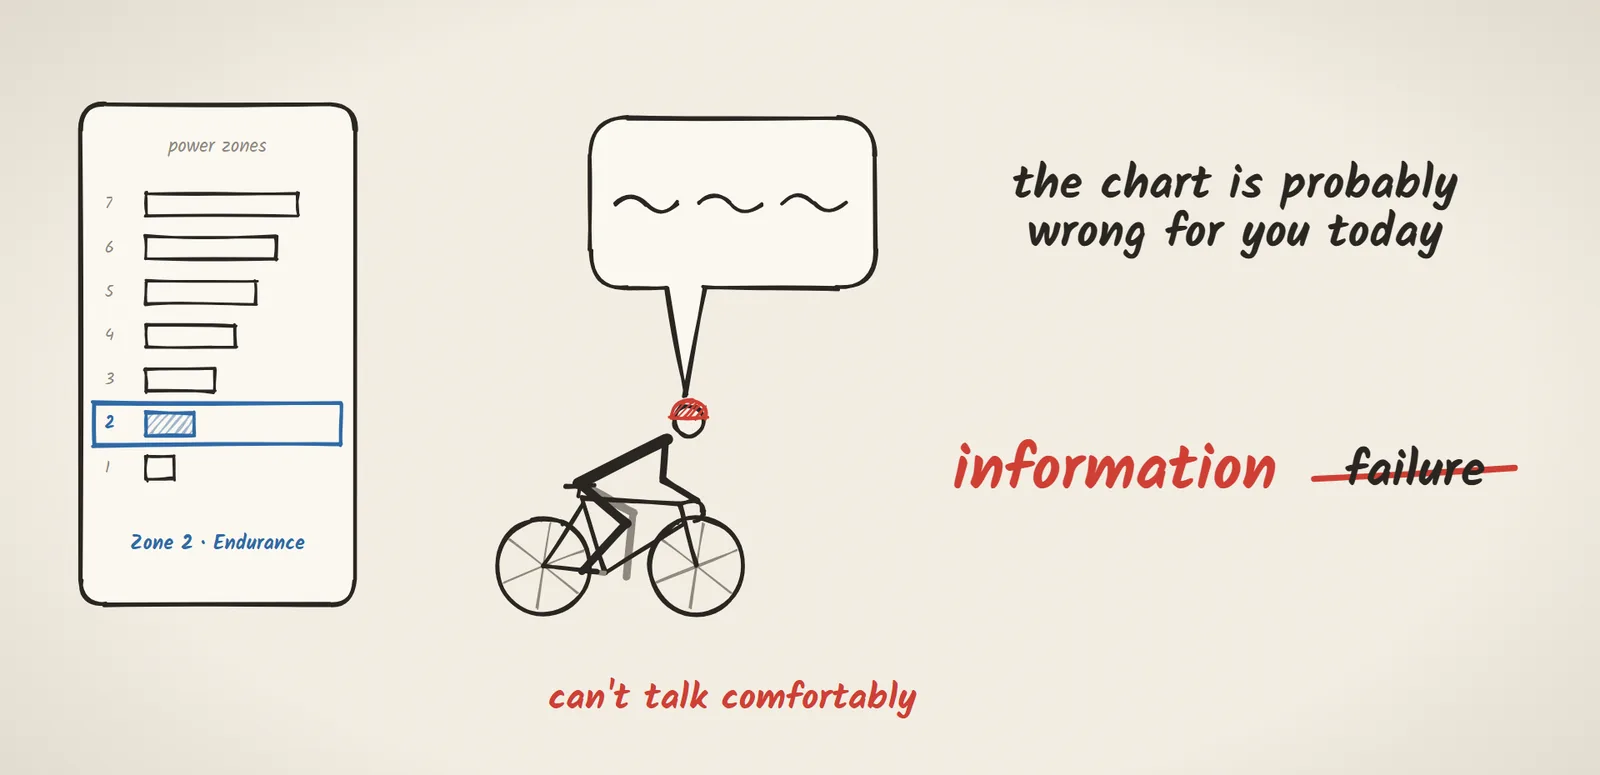
And if your chart says endurance but you can’t talk comfortably, the chart is probably wrong for you today. That’s information, not failure.
That’s what’s underneath the watts.
Sources
The study
- Iannetta D, Inglis EC, Mattu AT, Fontana FY, Pogliaghi S, Keir DA, Murias JM. A critical evaluation of current methods for exercise prescription in women and men. Med Sci Sports Exerc. 2020;52(2):466-473. doi.org/10.1249/MSS.0000000000002147
Also in this article
- Seiler KS, Kjerland GØ. Quantifying training intensity distribution in elite endurance athletes: is there evidence for an “optimal” distribution? Scand J Med Sci Sports. 2006;16(1):49-56. doi.org/10.1111/j.1600-0838.2004.00418.x
Written and researched by Yarin Podoler, a cyclist who wanted to know what’s underneath the watts.