Why can I surge above threshold and still recover?
Because above your threshold, you’re spending from a limited reserve of extra work, and a short surge spends only part of it. Drop back below it, and the reserve refills: gradually, and faster the further below you go.
The video version, 4:28, narrated by a synthetic voice. Watch on YouTube · Watch the Short
A group ride, surge after surge
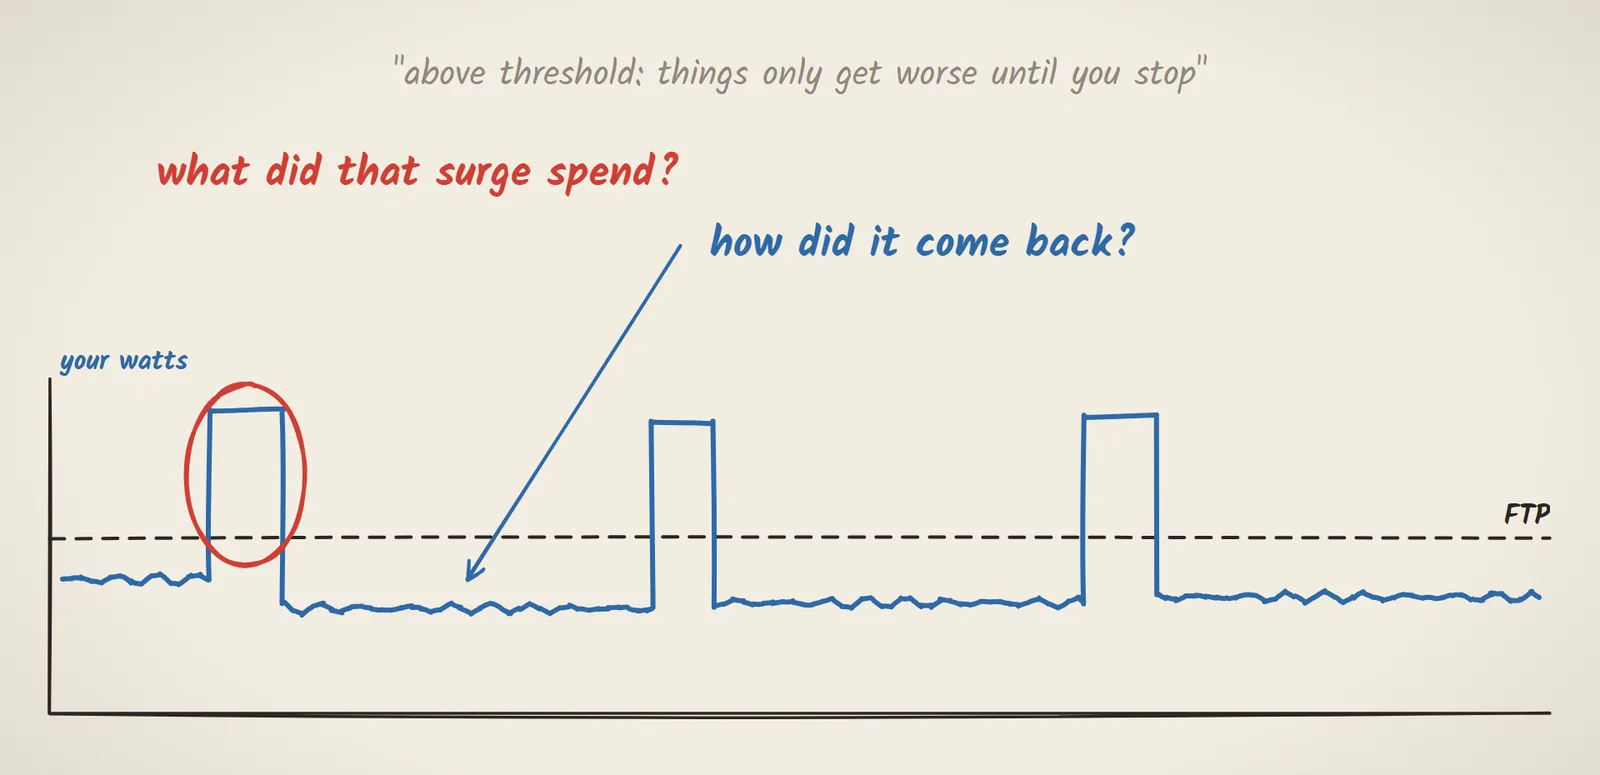
You’re on a group ride. The road kicks up, someone pushes the pace, and for 20 or 30 seconds you’re far above your FTP, breathing hard, legs burning. Over the top, you sit back in the wheels, and a couple of minutes later you feel almost normal. Then it happens again on the next rise, and the next. But above threshold is supposed to be where things only get worse until you stop. So what did that surge actually spend, and how did it come back?
The line, and what happens on each side
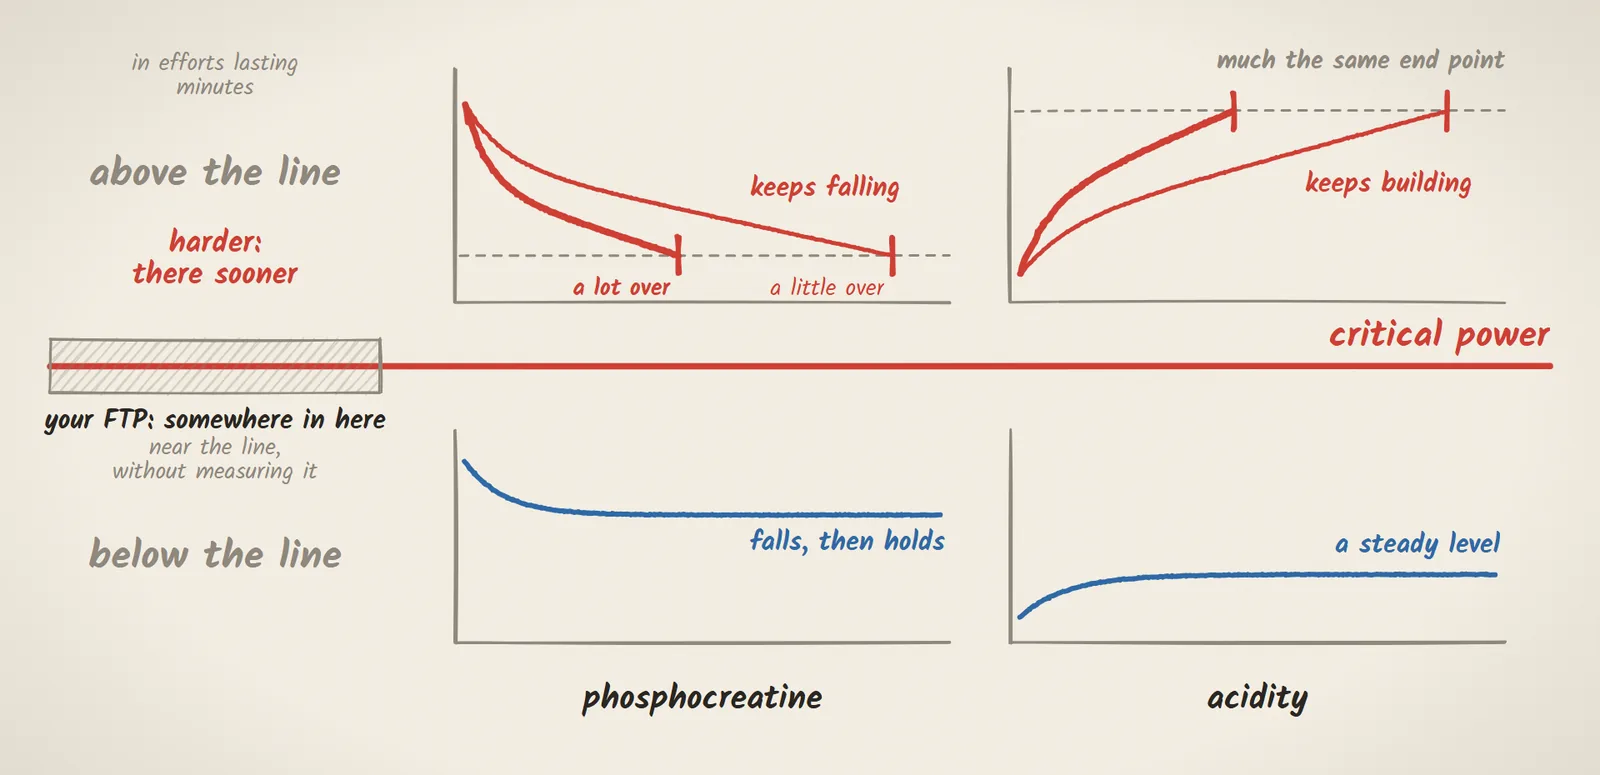
Start with what threshold means here. There’s a real boundary in your physiology, and one well-tested way to locate it is called critical power. Your FTP lands somewhere near that line, without measuring it. Below the line, the chemistry inside your working muscle settles. Phosphocreatine, a fast backup that keeps the muscle’s energy supply topped up, falls and then holds, and acidity finds a steady level too. Above the line, none of it settles. Phosphocreatine keeps falling and acid keeps building until you stop, and in efforts that last minutes rather than seconds, that end point tends to be much the same whether you were a little over the line or a lot. Going harder just gets you there sooner.
W′, the reserve above the line
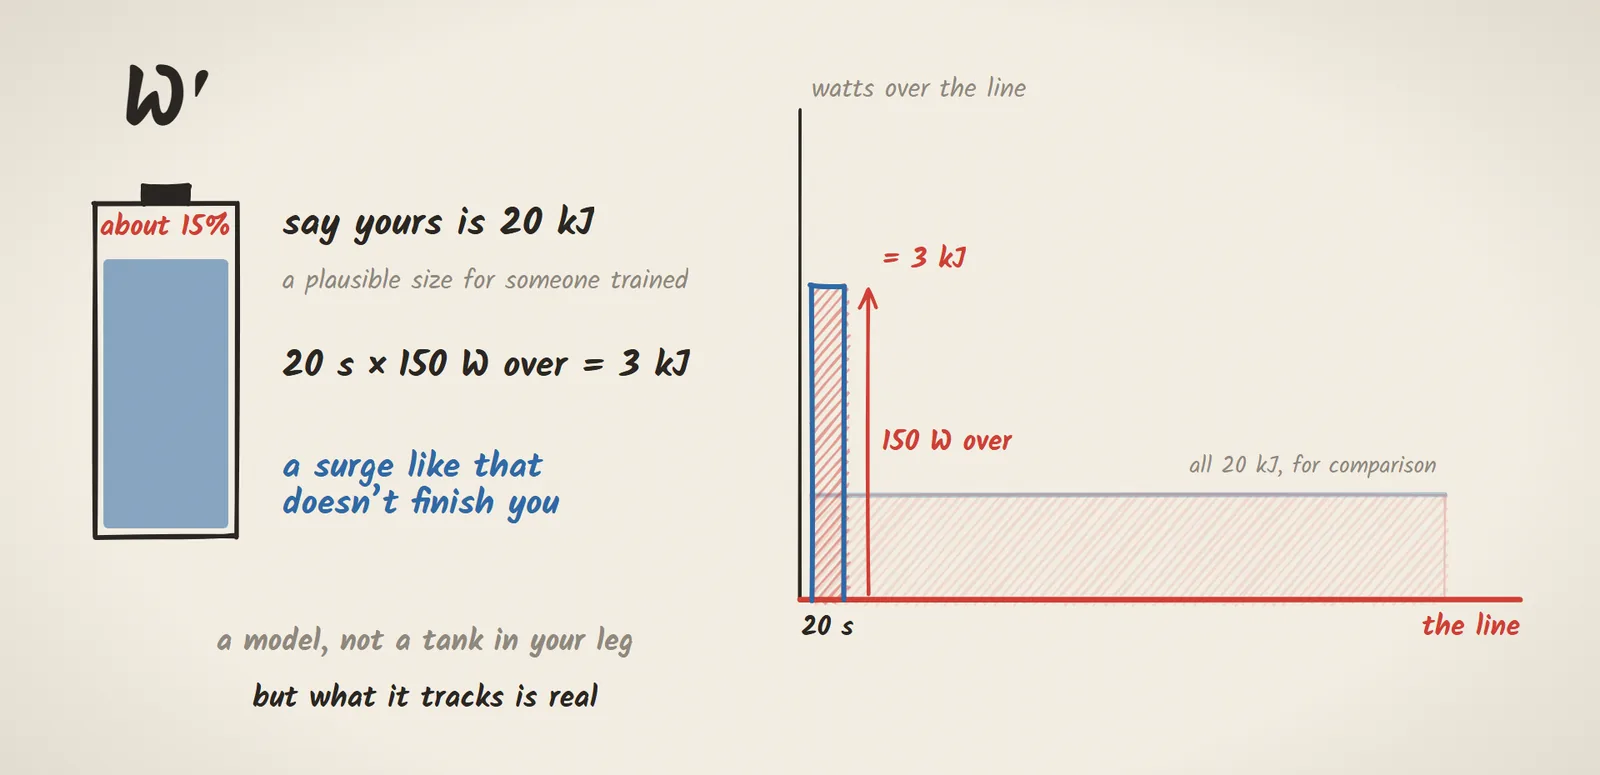
So above the line, there’s only so far you can go, and the standard model measures that distance as an amount of work, called W prime. It’s in kilojoules, its size differs from rider to rider, and every second over the line spends some of it, faster the further over you are. Say yours is 20 kJ, a plausible size for someone trained. Twenty seconds at 150 W over the line spends 3 of them, about 15%. That’s why a surge like that doesn’t finish you. It’s a model, not a tank in your leg, but what it tracks is real.
How it refills
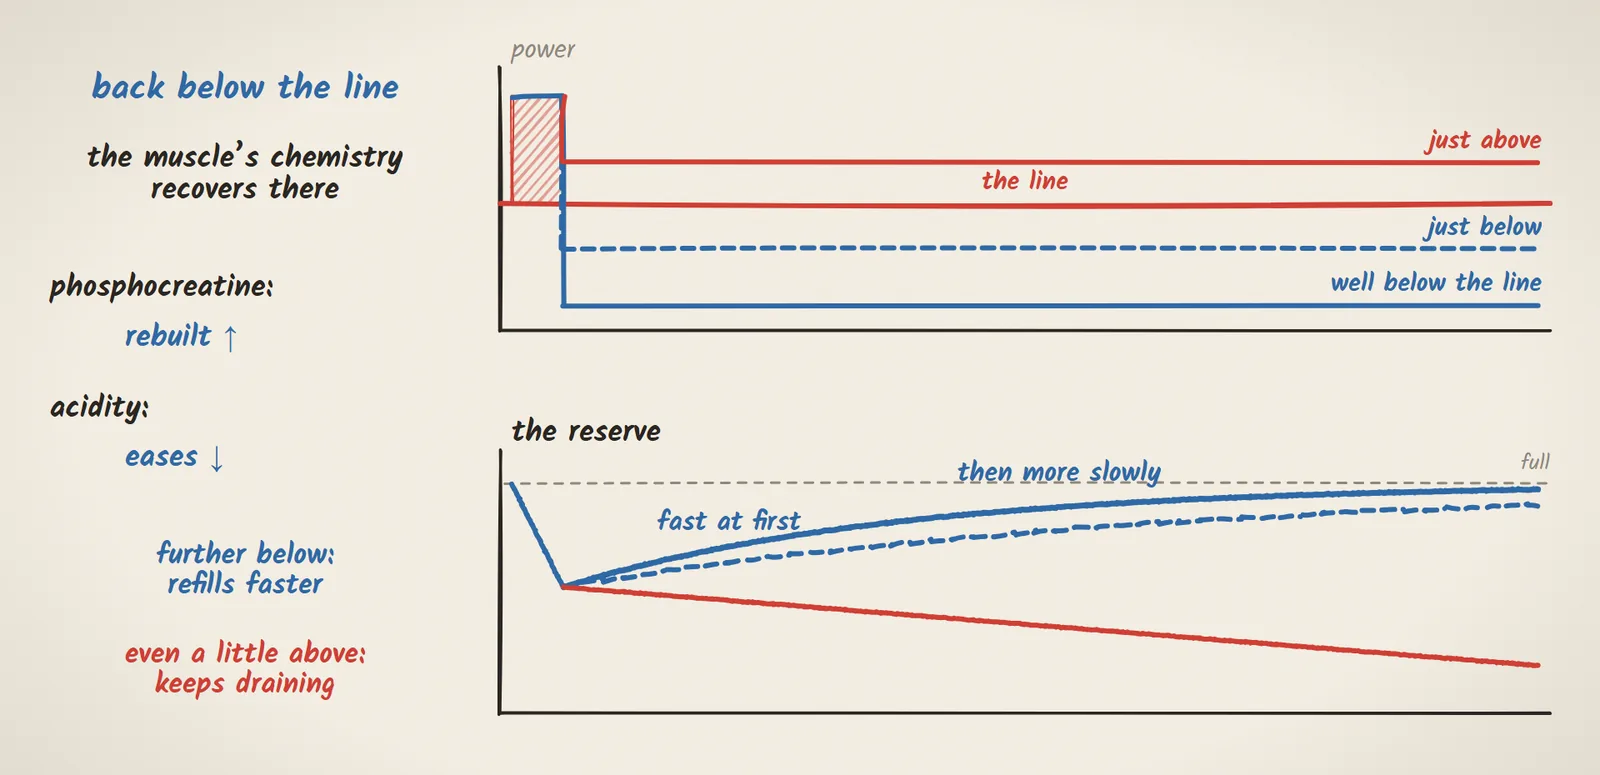
Then drop back below the line. The muscle’s chemistry can recover there: phosphocreatine is rebuilt and the acidity eases. And the reserve refills, though not all at once: fast at first, then more slowly, and faster the further below the line you drop. Stay above the line, even a little, and the reserve keeps draining, just more slowly.
The experiment
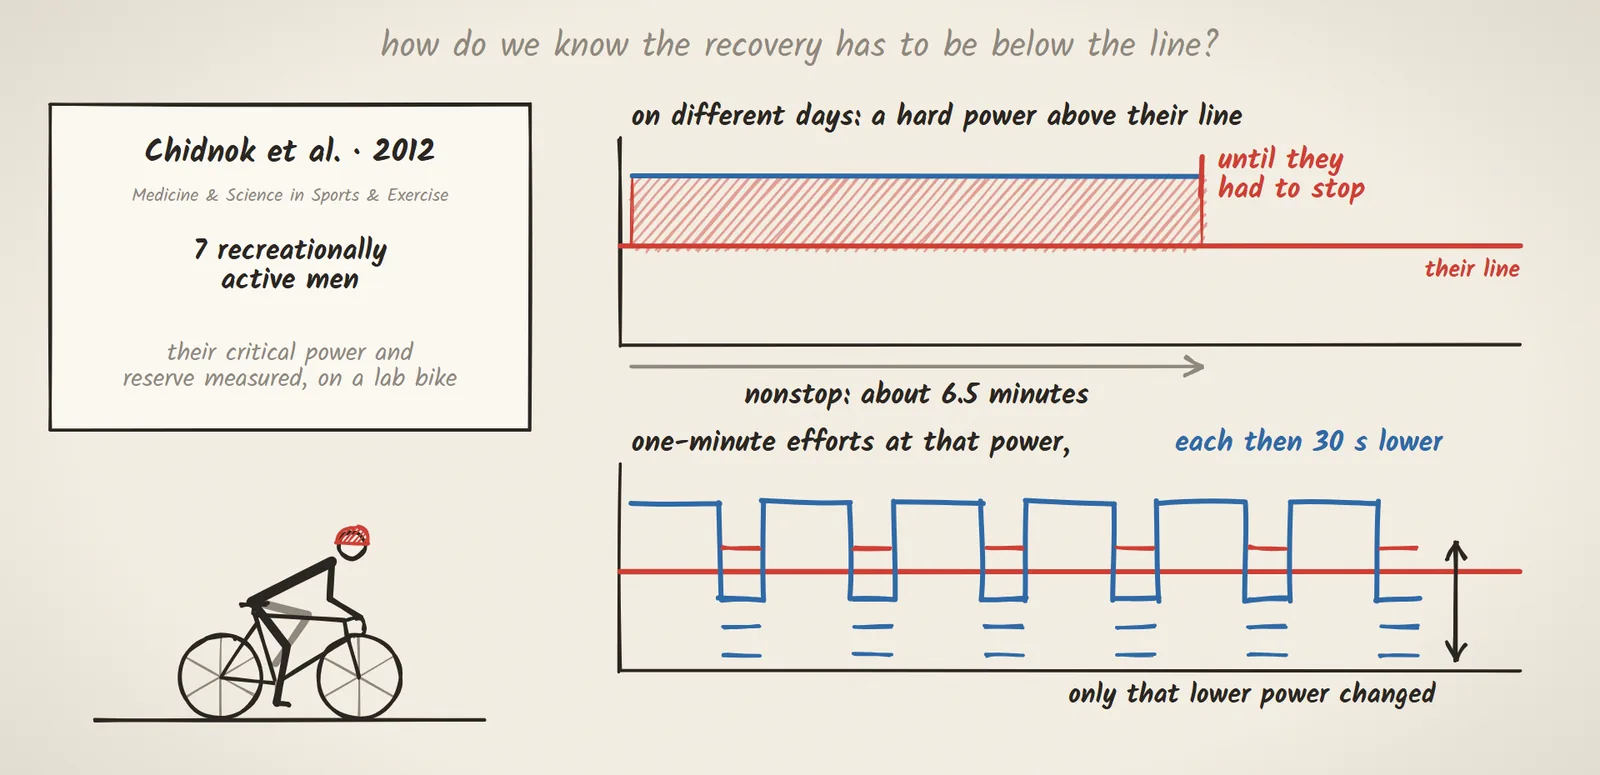
How do we know the recovery has to be below the line? In one study, 7 recreationally active men had their critical power and their reserve measured on a lab bike. Then, on different days, they rode a hard power above their line until they had to stop. Ridden nonstop, it lasted them about 6.5 minutes. In the other rides, they did it as one-minute efforts, each followed by 30 seconds at a lower power, and only that lower power changed.
What they found
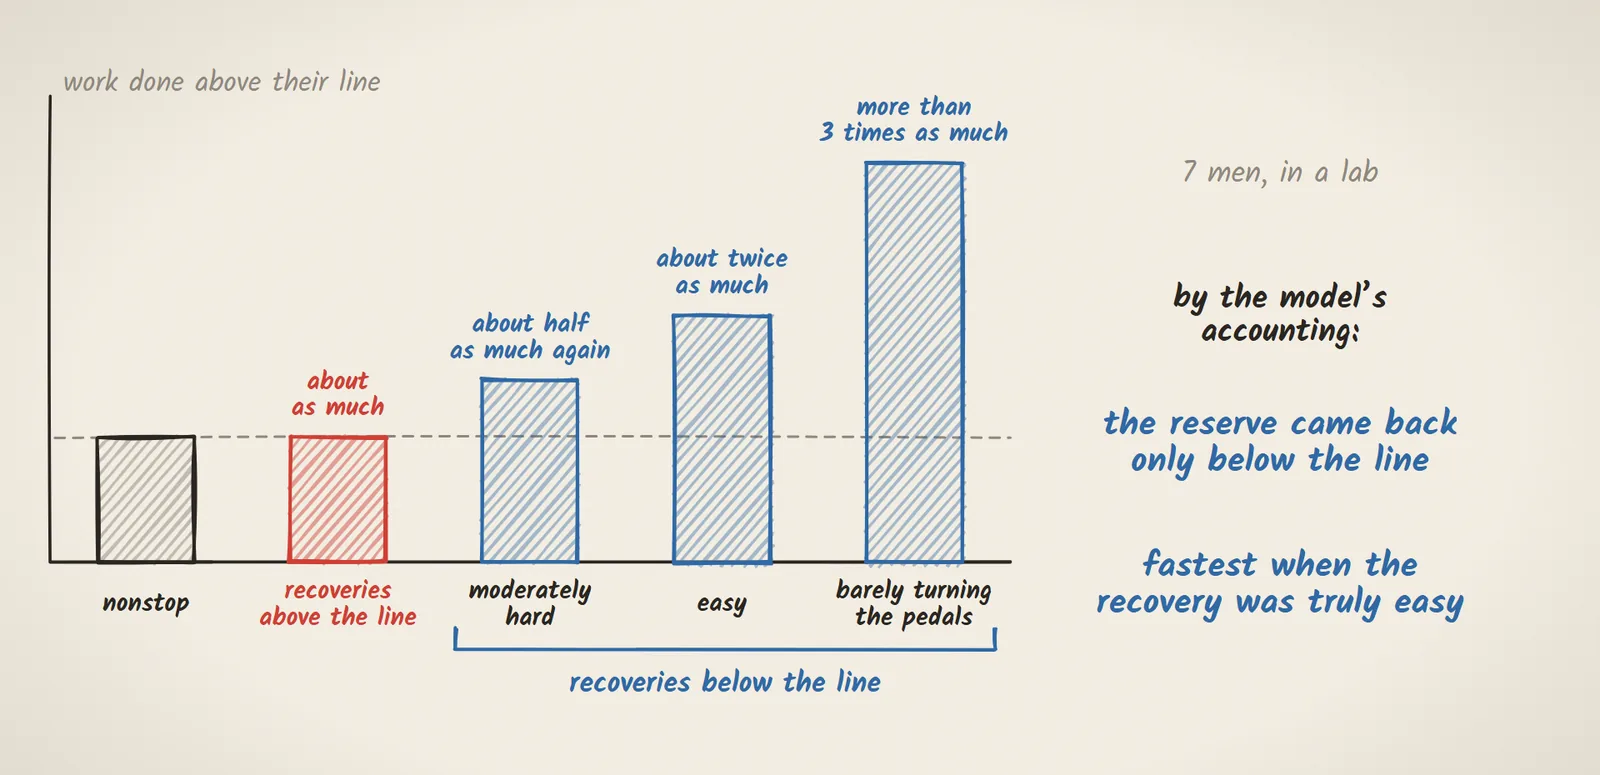
When those 30 seconds were still above their line, they did about as much work above it as riding nonstop. Below the line, they did more, and the easier the recovery, the more: about half as much again at a moderately hard pace, about twice as much at an easy one, and more than 3 times as much when they barely turned the pedals. Seven men, in a lab, but by the model’s accounting, the reserve came back only below the line, and fastest when the recovery was truly easy.
What it means for you
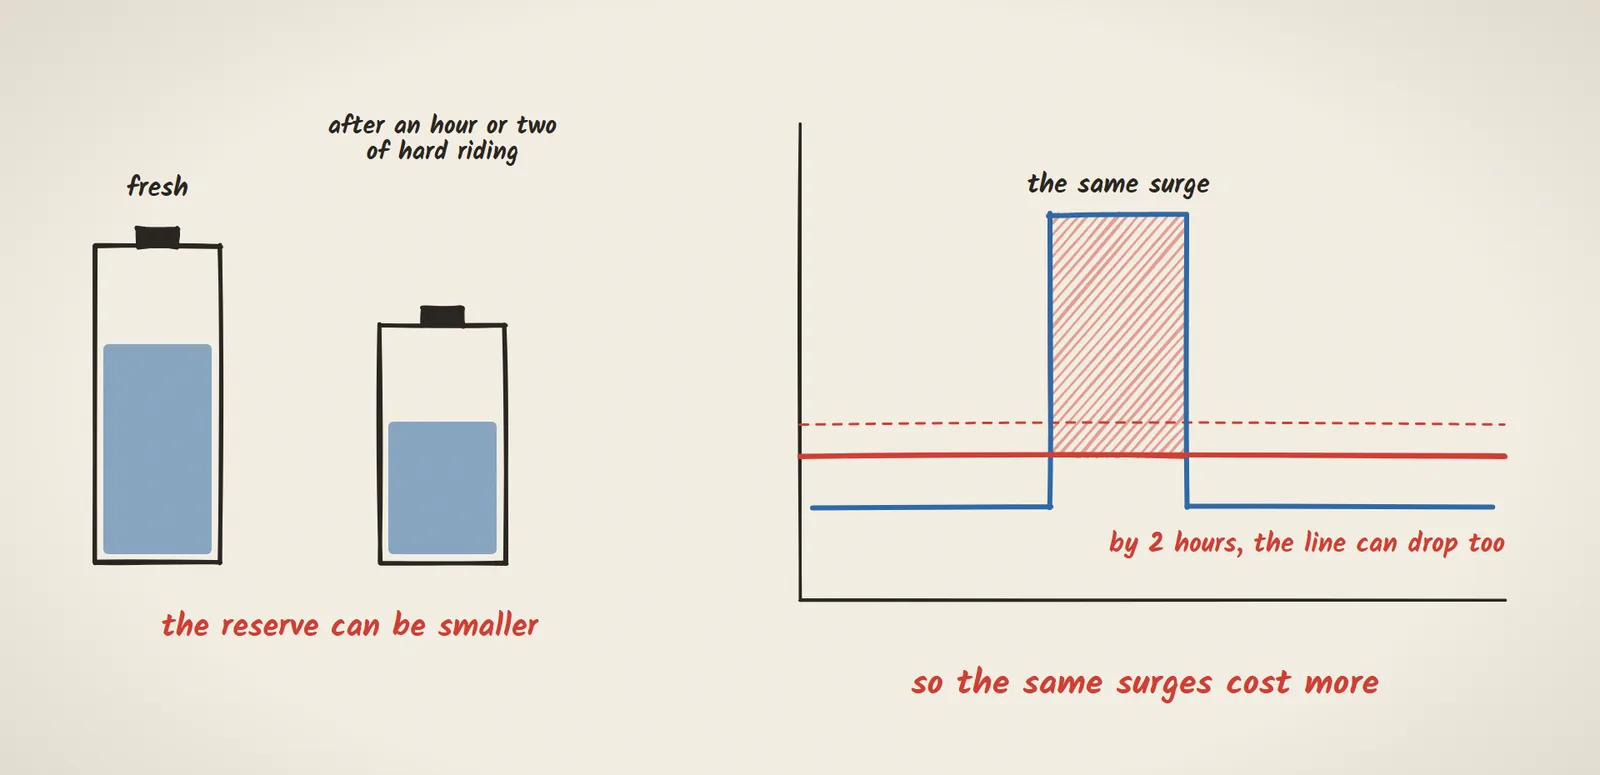
So what does this mean for you? One surge isn’t the problem. The trouble starts when you spend the reserve faster than it comes back: surges too big, too long or too close together, or recoveries that never drop far below the line because the group is still rolling. So when you get the chance, make the recovery genuinely easy, and give it time. In another study, 6 men rode to exhaustion and then barely turned the pedals, at about 20 W: after 2 minutes, a little over a third of their reserve was back, after 6 about two-thirds, and after 15, still not all of it. And after an hour or two of hard riding, the reserve itself can be smaller, and by 2 hours the line can drop too, so the same surges cost more.
That’s what’s underneath the watts.
Sources
The study
- Chidnok W, DiMenna FJ, Bailey SJ, Vanhatalo A, Morton RH, Wilkerson DP, Jones AM. Exercise tolerance in intermittent cycling: application of the critical power concept. Med Sci Sports Exerc. 2012;44(5):966-976. doi.org/10.1249/MSS.0b013e31823ea28a
- (7 recreationally active men on a lab bike. With their critical power and W′ measured, they rode a hard power above critical power until they had to stop: nonstop, about 6.5 minutes, and as 60-second efforts at that power, each followed by 30 seconds at a lower power, which alone changed between rides: above critical power, or at three levels below it, the easiest 20 W. Work done above critical power was about the same with recoveries above it, and 46%, 98% and 220% greater with the three below.) As described in: Jones AM, Vanhatalo A. The 'Critical Power’ Concept: Applications to Sports Performance with a Focus on Intermittent High-Intensity Exercise. Sports Med. 2017;47(Suppl 1):65-78. doi.org/10.1007/s40279-017-0688-0
Also in this article
- The reserve after exhaustion, at about 20 W (6 men): Ferguson C, Rossiter HB, Whipp BJ, Cathcart AJ, Murgatroyd SR, Ward SA. Effect of recovery duration from prior exhaustive exercise on the parameters of the power-duration relationship. J Appl Physiol. 2010;108(4):866-874. doi.org/10.1152/japplphysiol.91425.2008
- The model of spending and refilling the reserve, fitted to the study’s data: Skiba PF, Chidnok W, Vanhatalo A, Jones AM. Modeling the expenditure and reconstitution of work capacity above critical power. Med Sci Sports Exerc. 2012;44(8):1526-1532. doi.org/10.1249/MSS.0b013e3182517a80
- The muscle’s chemistry below and above critical power, and much the same end point in efforts lasting minutes: Jones AM, Wilkerson DP, DiMenna F, Fulford J, Poole DC. Muscle metabolic responses to exercise above and below the “critical power” assessed using 31P-MRS. Am J Physiol Regul Integr Comp Physiol. 2008;294(2):R585-R593. doi.org/10.1152/ajpregu.00731.2007
- Vanhatalo A, Fulford J, DiMenna FJ, Jones AM. Influence of hyperoxia on muscle metabolic responses and the power-duration relationship during severe-intensity exercise in humans: a 31P magnetic resonance spectroscopy study. Exp Physiol. 2010;95(4):528-540. doi.org/10.1113/expphysiol.2009.050500
- Black MI, Jones AM, Blackwell JR, et al. Muscle metabolic and neuromuscular determinants of fatigue during cycling in different exercise intensity domains. J Appl Physiol. 2017;122(3):446-459. doi.org/10.1152/japplphysiol.00942.2016
- After hours of hard riding, a smaller reserve, then a lower line: Clark IE, Vanhatalo A, Thompson C, et al. Dynamics of the power-duration relationship during prolonged endurance exercise and influence of carbohydrate ingestion. J Appl Physiol. 2019;127(3):726-736. doi.org/10.1152/japplphysiol.00207.2019
Written and researched by Yarin Podoler, a cyclist who wanted to know what’s underneath the watts.