Why can’t I hold intervals just above my FTP?
Because FTP is an estimate of your threshold, not a measurement of it. It can land above your real limit, and a few percent past that limit, your body can no longer settle.
The video version, 4:44, narrated by a synthetic voice. Watch on YouTube · Watch the Short
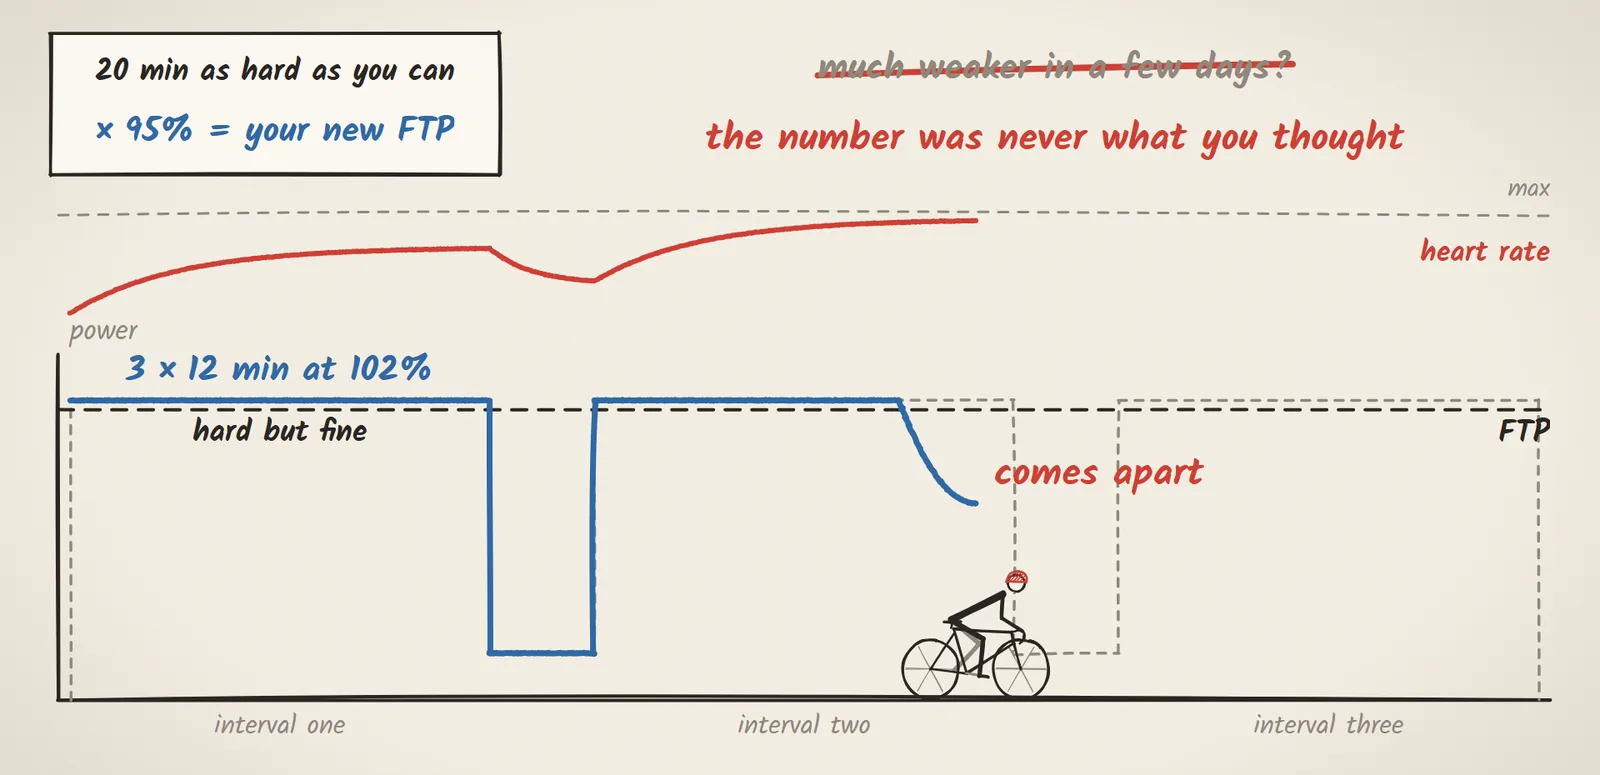
The session that comes apart
You test: 20 minutes as hard as you can hold, and your software takes 95% of it and hands you a new FTP. A few days later you do a session built on it, 3 × 12 minutes at 102%, barely above the number you just set. The first interval is hard but fine. Then you come apart in the second one, heart rate somewhere it has no business being, the target power sliding away no matter what you do with your legs. You almost certainly didn’t get much weaker in a few days. More likely, that number was never quite what you thought it was.
What FTP actually is
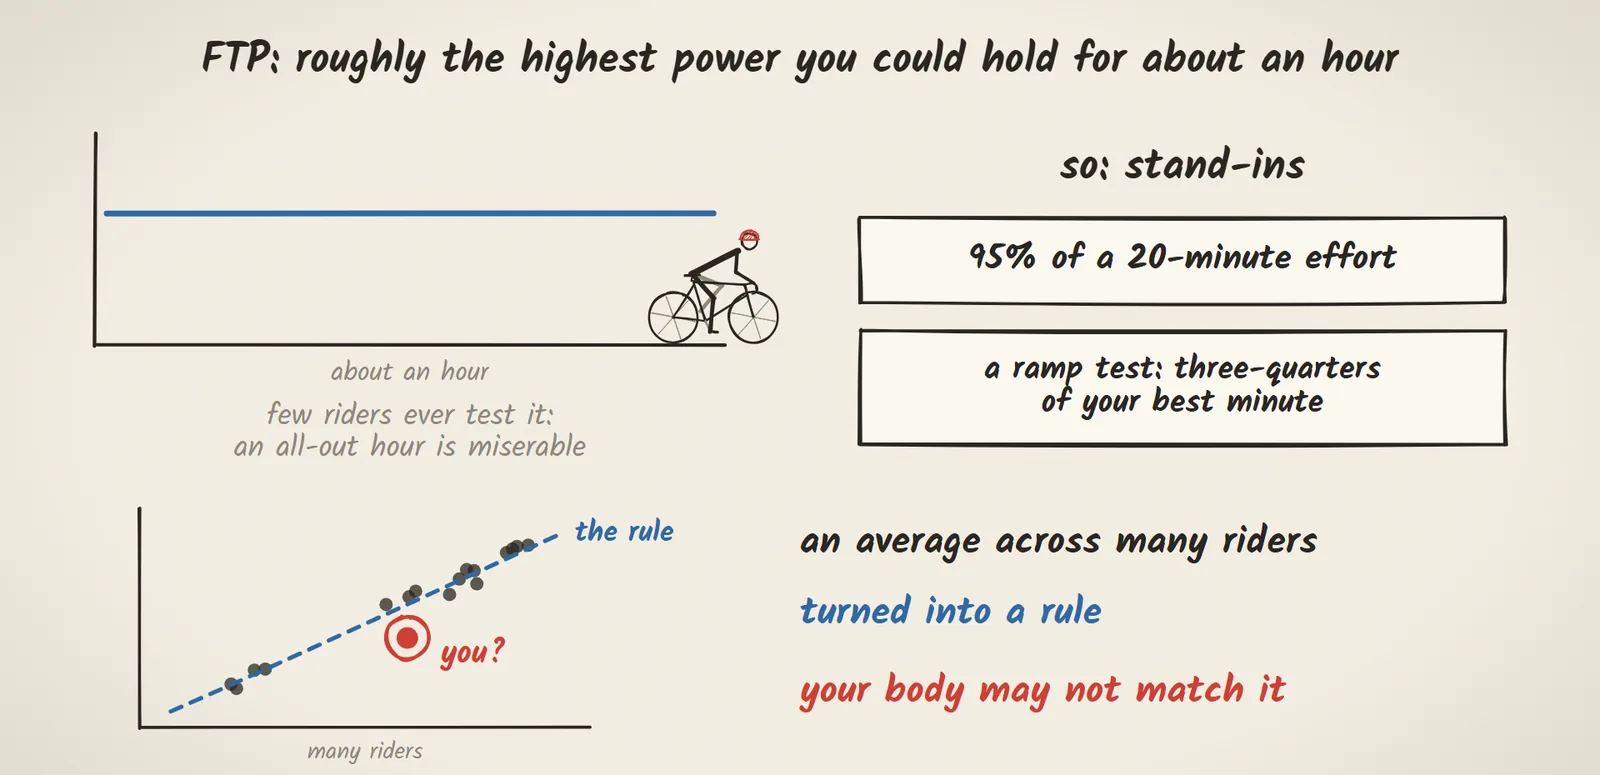
Start with what FTP actually is. By its usual definition, it’s roughly the highest power you could hold for about an hour. Few riders ever test that directly, because an all-out hour is miserable, so we use stand-ins: 95% of a 20-minute effort, or a ramp test that takes three-quarters of your best minute. Each one turns an average across many riders into a rule, and your body may not match the average.
Critical power: the line where things stop settling
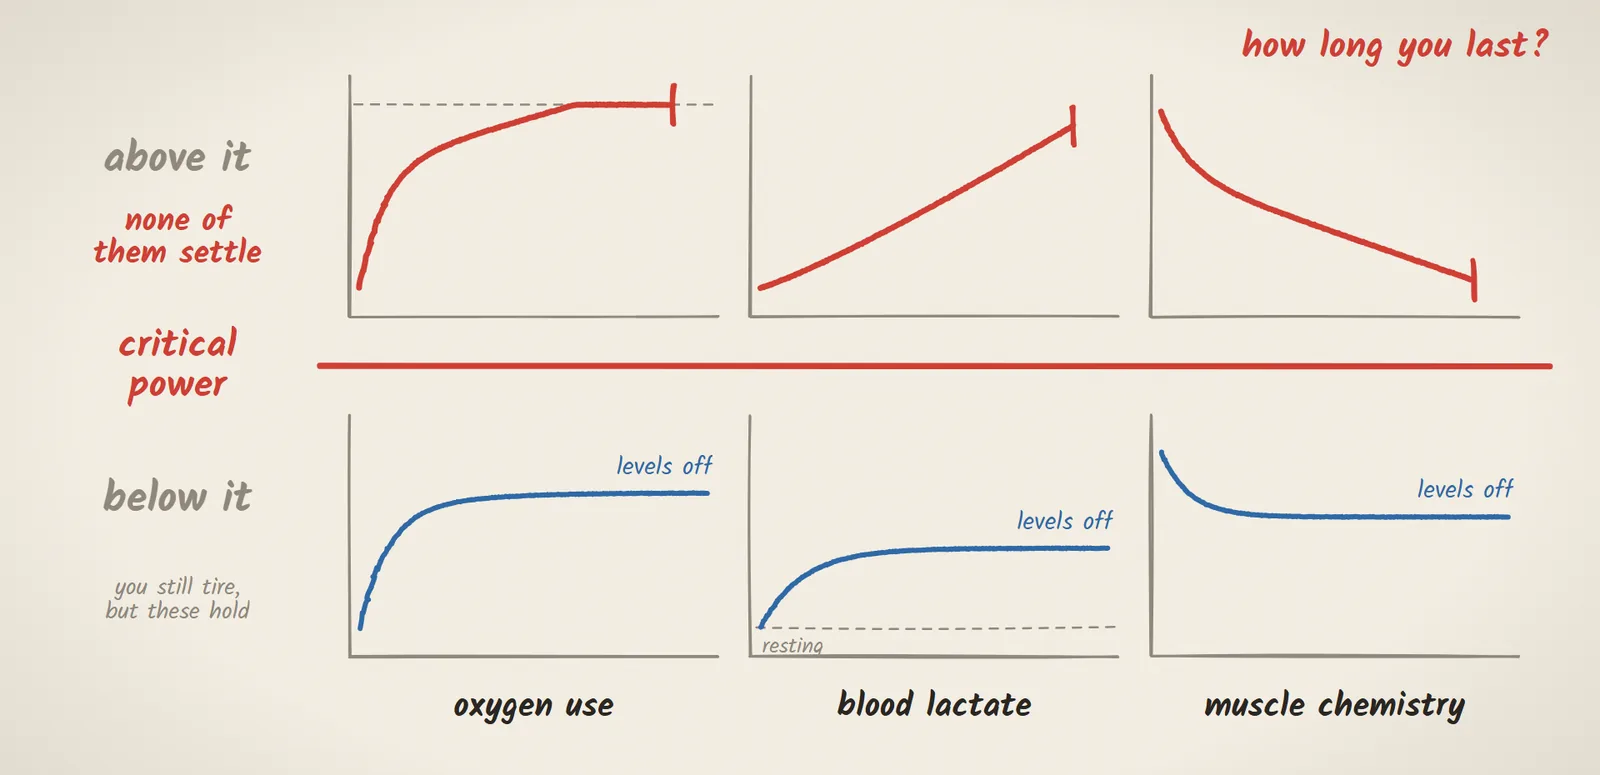
Underneath, there’s a real boundary in your physiology, and one well-tested way to locate it is called critical power. Below it, oxygen use and blood lactate level off, even if they’re raised, and the chemistry inside the muscle finds a new balance. You’ll still tire eventually, but not because those numbers keep running away. Above it, none of them settle. Every minute takes you further from where you started, and the only open question is how long you last.
W′, the reserve above the line
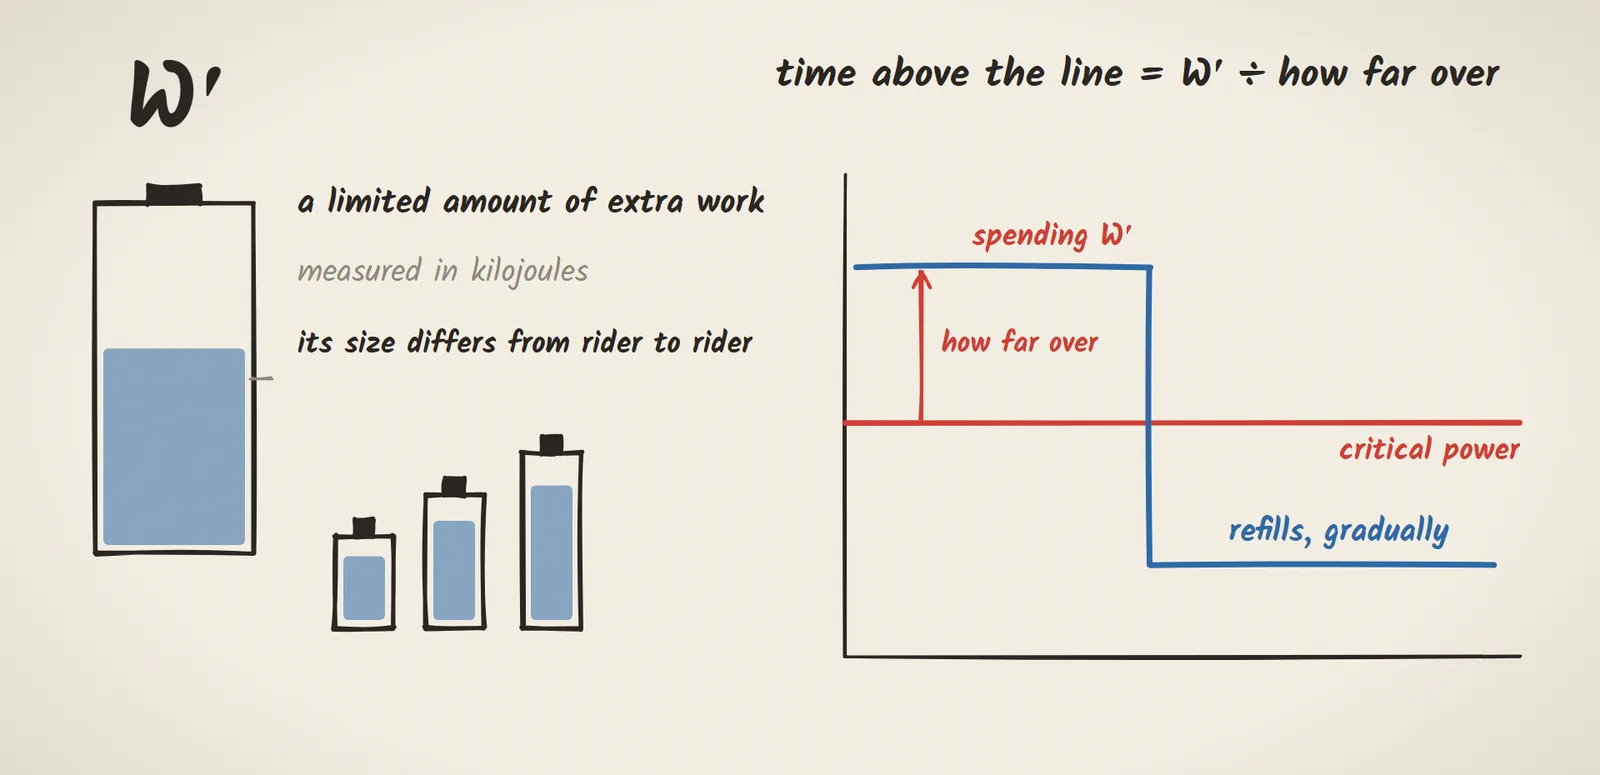
Above critical power, the standard model gives you a limited amount of extra work to spend, called W prime. It’s measured in kilojoules, and its size differs from rider to rider. How long you last above the line is that amount divided by how far over you are, and it only refills once you drop back below, gradually.
Why it’s the second interval
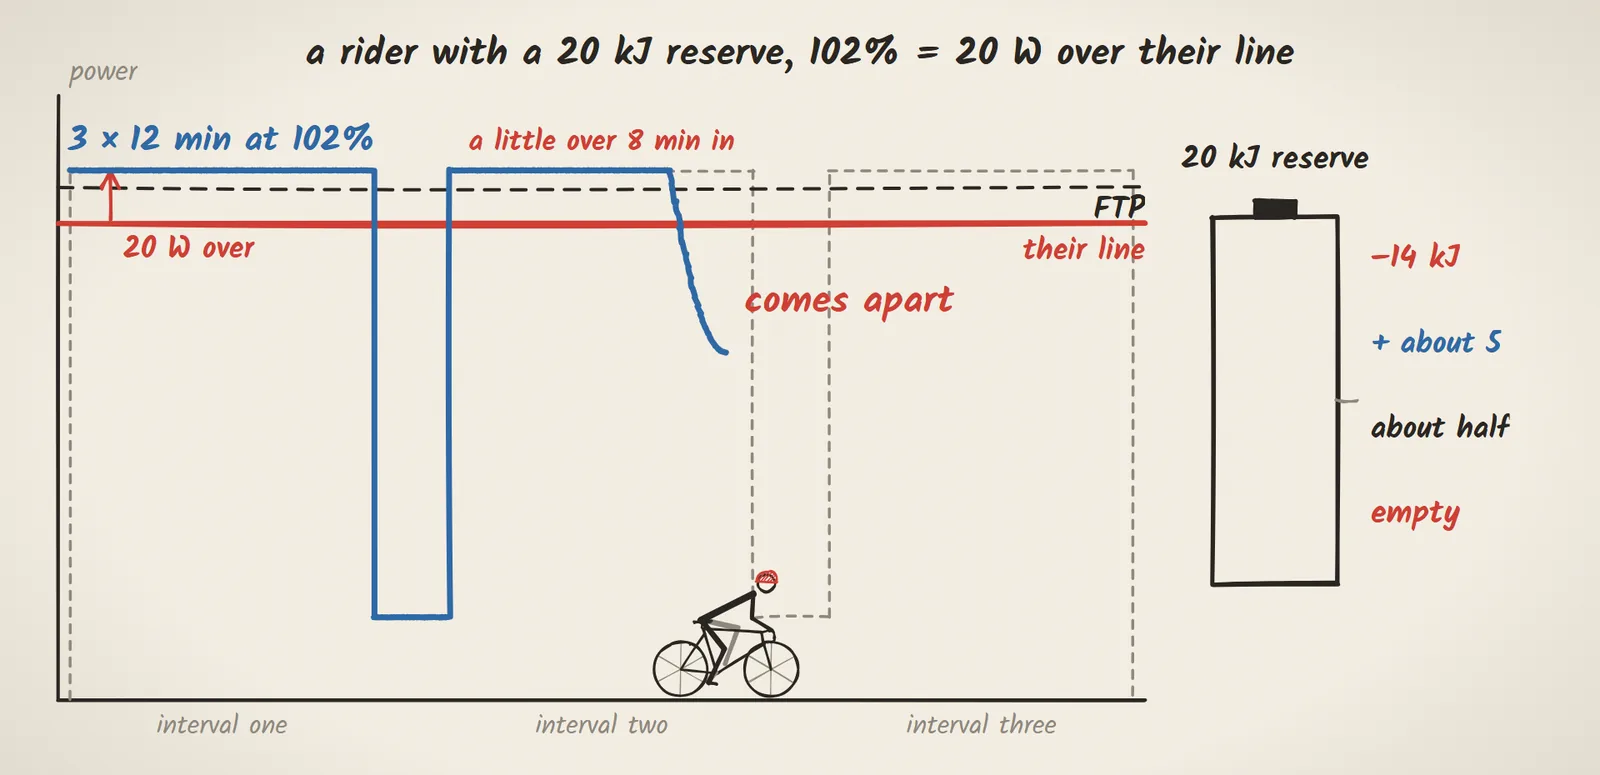
FTP’s stand-ins don’t measure that line directly, and studies comparing FTP with lab measurements find it isn’t reliably on it: the miss differs from rider to rider, in size and in direction. So take a rider with a 20 kJ reserve, a plausible size for someone trained, and say 102% put them 20 W over their line. The first interval spends about 14 kJ. Three easy minutes of recovery give back about 5, by the model’s numbers. So the second interval starts with about half the reserve, and runs out a little over 8 minutes in, which is what falling apart in the second interval feels like.
The experiment
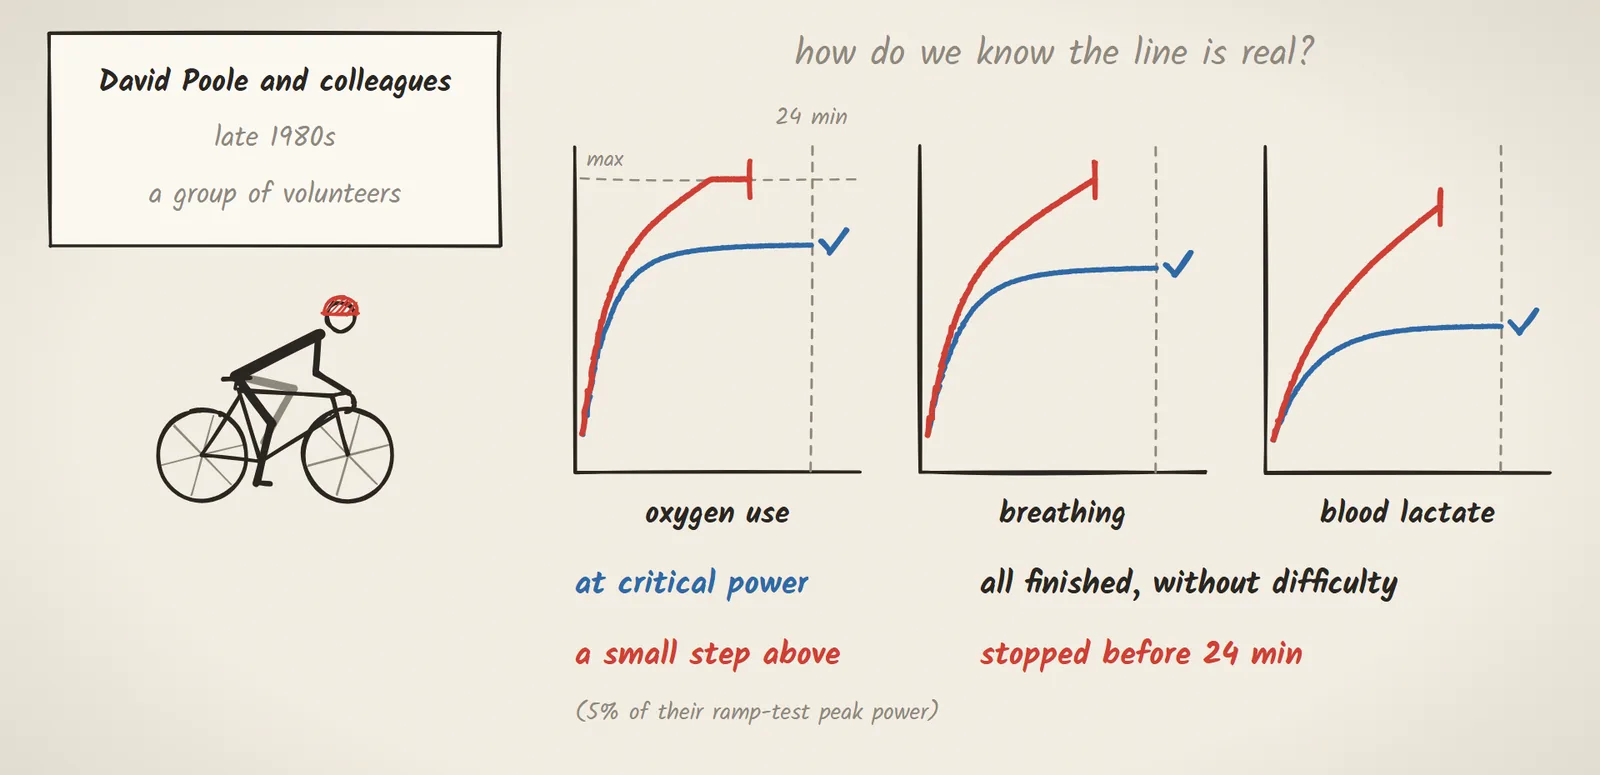
So how do we know the line is real, and not just a number fitted to a curve? In the late 1980s, David Poole and colleagues found critical power for a group of volunteers, then had them ride right at it, aiming for 24 minutes. Their oxygen use, their breathing and their blood lactate all levelled off, and every one of them finished the 24 minutes without difficulty. Then they rode a small step above it, about 5% of the peak power they’d reached in a ramp test. This time none of it levelled off: oxygen use climbed to its maximum, lactate kept rising, and they stopped before the 24 minutes were up.
What it means for you
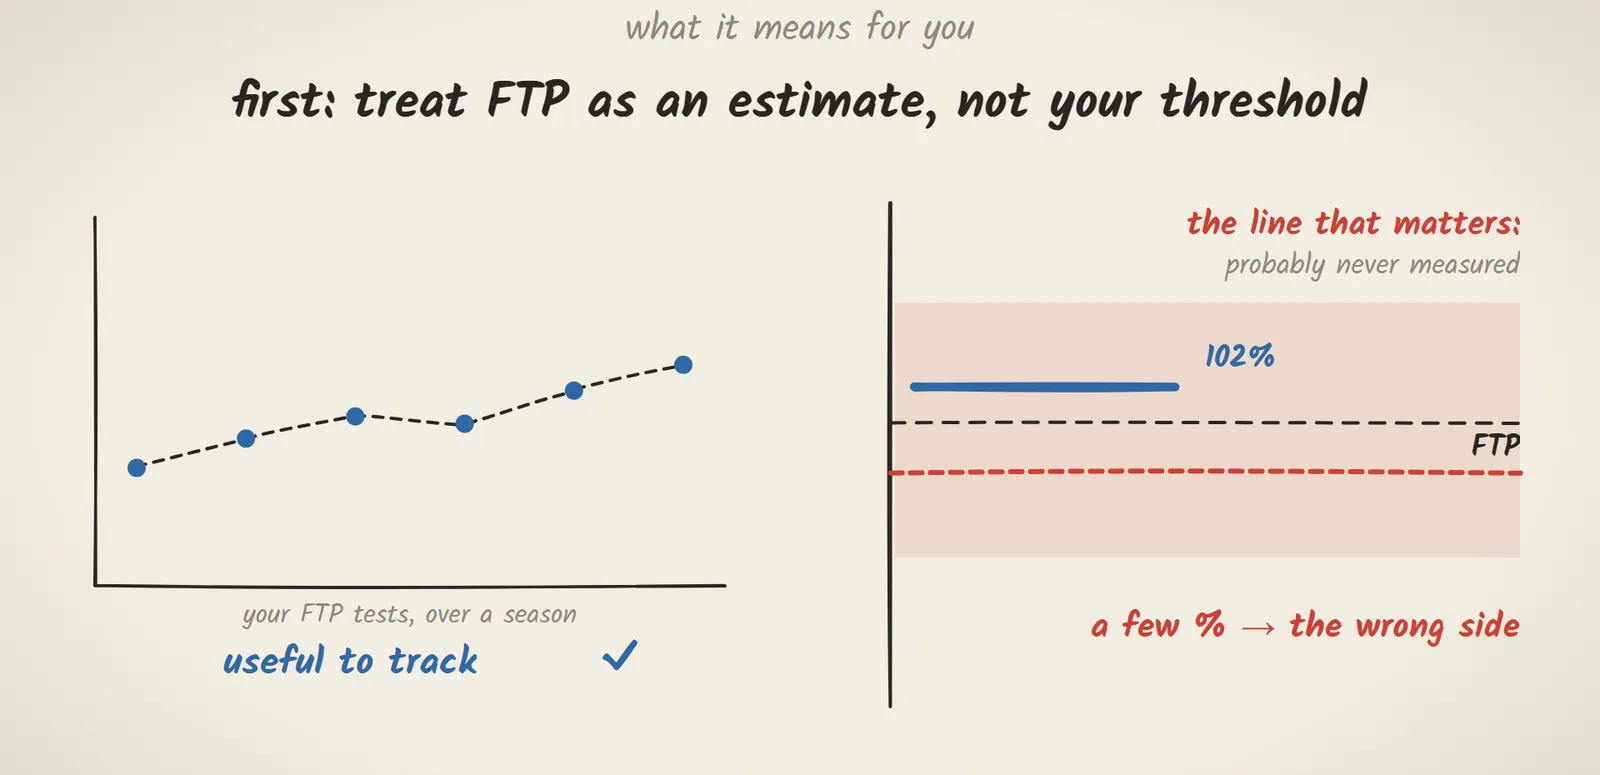
So what does this mean for you? First, treat FTP as an estimate, not as your threshold. As a repeatable number to track over time, it’s useful. For intervals pitched just above it, the line that matters is one you’ve probably never measured, and a few percent can move you to the wrong side of it.
When an interval collapses
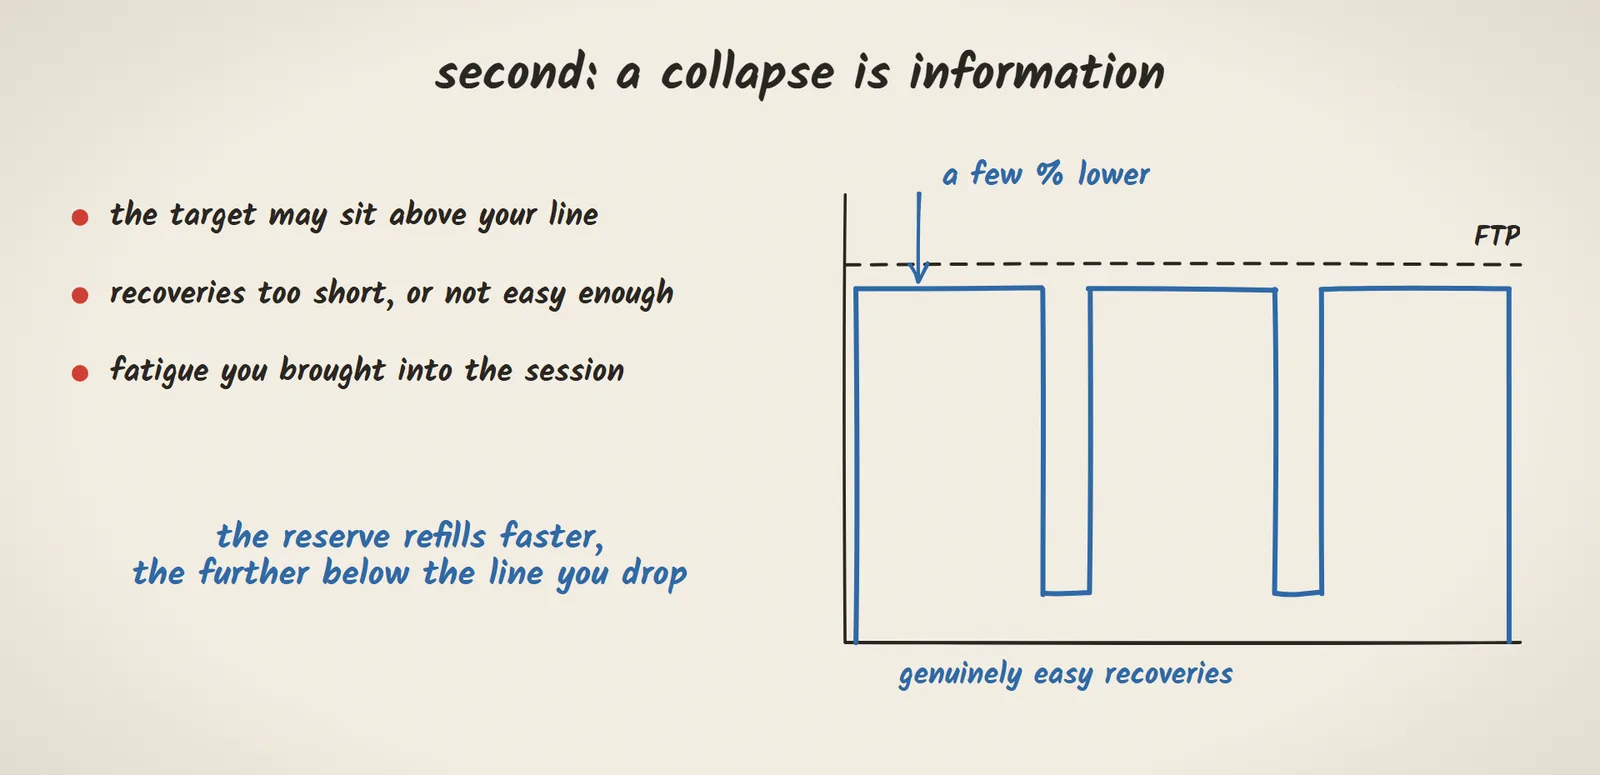
Second, when the second interval collapses, read it as information. The target may sit above your line, the recoveries may be too short or not easy enough, or you may have brought fatigue into the session. Try the target a few percent lower, and make the recoveries genuinely easy, because the reserve refills faster the further below the line you drop.
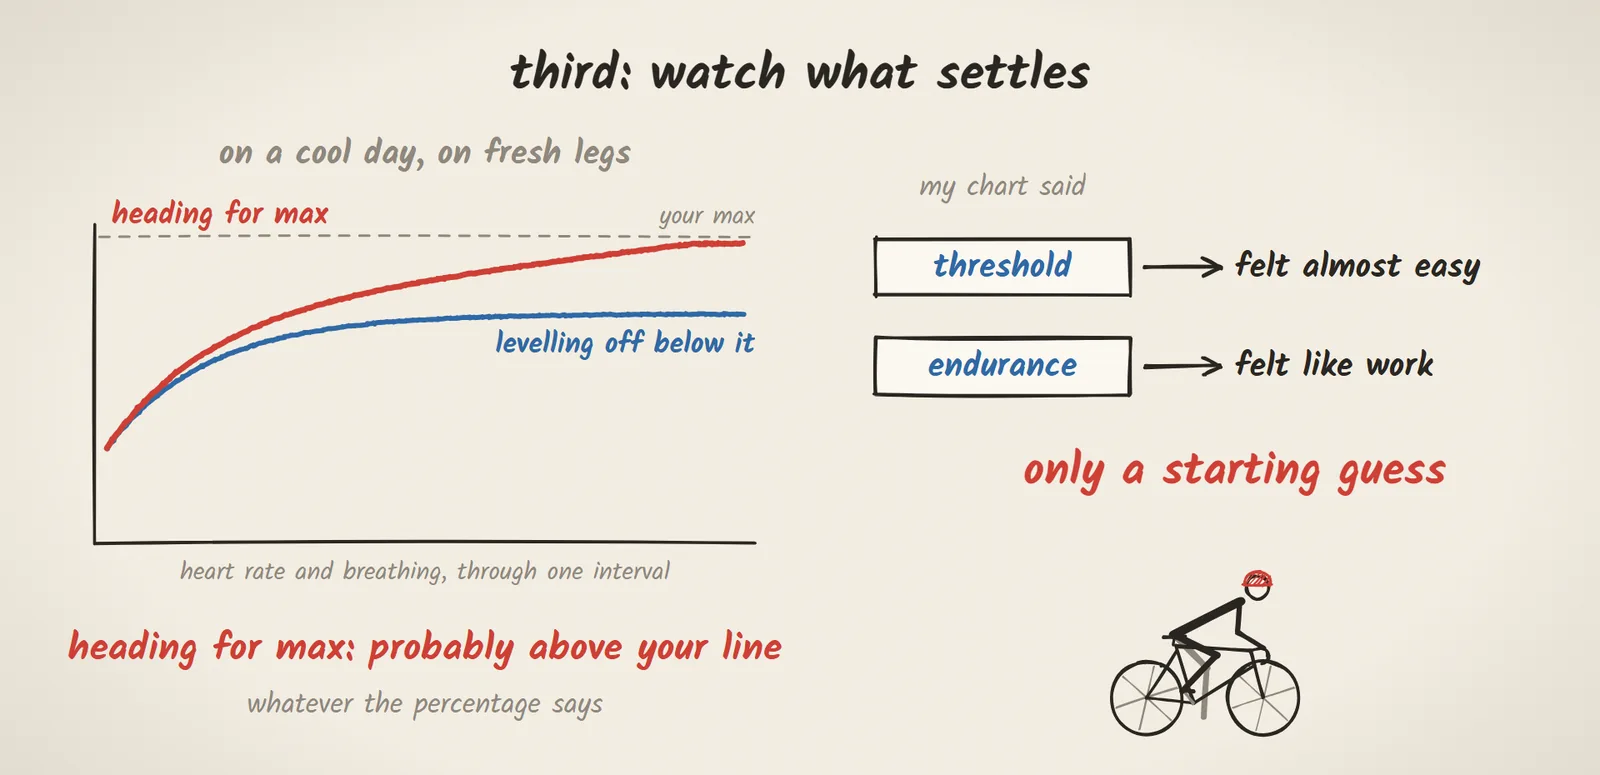
Watch what settles
And third, watch what settles. On a cool day, on fresh legs, if your heart rate and breathing are heading for your maximum by the end of an interval, instead of levelling off below it, you’re probably above your line, whatever the percentage says. I’ve had powers my chart called threshold feel almost easy, and powers it called endurance feel like work. The chart is only a starting guess.
That’s what’s underneath the watts.
Sources
The study
- Poole DC, Ward SA, Gardner GW, Whipp BJ. Metabolic and respiratory profile of the upper limit for prolonged exercise in man. Ergonomics. 1988;31(9):1265-1279. doi.org/10.1080/00140138808966766
- As described in: Poole DC, Burnley M, Vanhatalo A, Rossiter HB, Jones AM. Critical power: an important fatigue threshold in exercise physiology. Med Sci Sports Exerc. 2016;48(11):2320-2334. doi.org/10.1249/MSS.0000000000000939
Also in this article
- Borszcz FK, Tramontin AF, Costa VP. Is the functional threshold power interchangeable with the maximal lactate steady state in trained cyclists? Int J Sports Physiol Perform. 2019;14(8):1029-1035. doi.org/10.1123/ijspp.2018-0572
- Karsten B, Petrigna L, Klose A, Bianco A, Townsend N, Triska C. Relationship between the critical power test and a 20-min functional threshold power test in cycling. Front Physiol. 2021;11:613151. doi.org/10.3389/fphys.2020.613151
- Skiba PF, Chidnok W, Vanhatalo A, Jones AM. Modeling the expenditure and reconstitution of work capacity above critical power. Med Sci Sports Exerc. 2012;44(8):1526-1532. doi.org/10.1249/MSS.0b013e3182517a80
Written and researched by Yarin Podoler, a cyclist who wanted to know what’s underneath the watts.