Why does my heart rate keep rising on long rides at the same power?
The short answer is that it’s mostly your temperature, not your legs. The longer answer is a neat piece of physiology, with one experiment that shows how it works.
The video version, 4:21, narrated by a synthetic voice. Watch on YouTube · Watch the Short
Same watts, 13 more beats
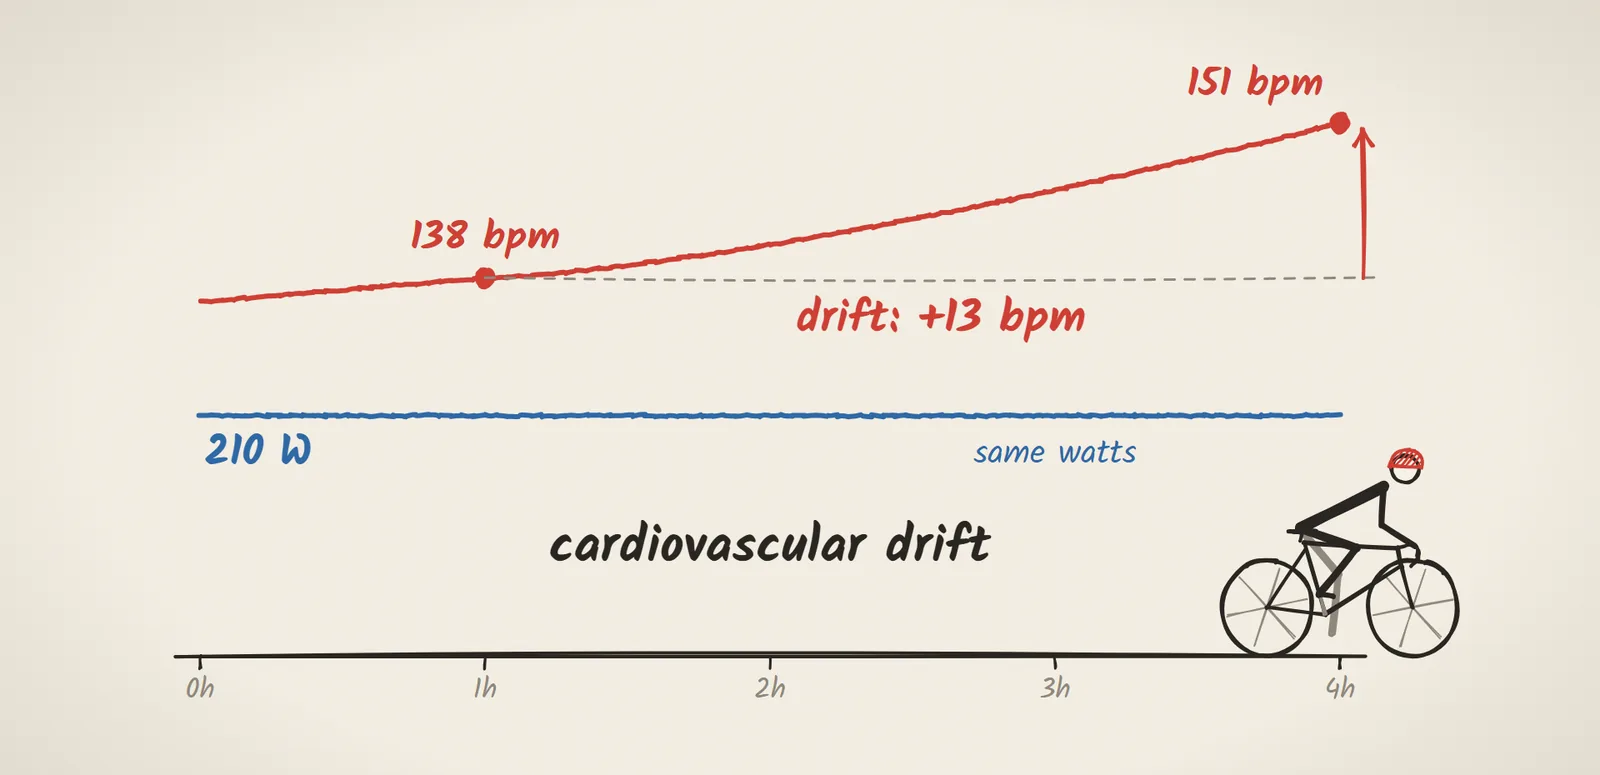
Picture a long endurance ride. Flat roads, 210 W, the number you’ve been holding since you clipped in. Nothing hurts, and nothing feels dramatic. In the first hour, that sits at about 138 beats per minute. Four hours in, at the same watts on the same legs, it’s 151. Thirteen more beats per minute for the identical power, and when you upload the ride, your training software tells you, politely, that your power-to-heart-rate ratio drifted. That has a name: cardiovascular drift.
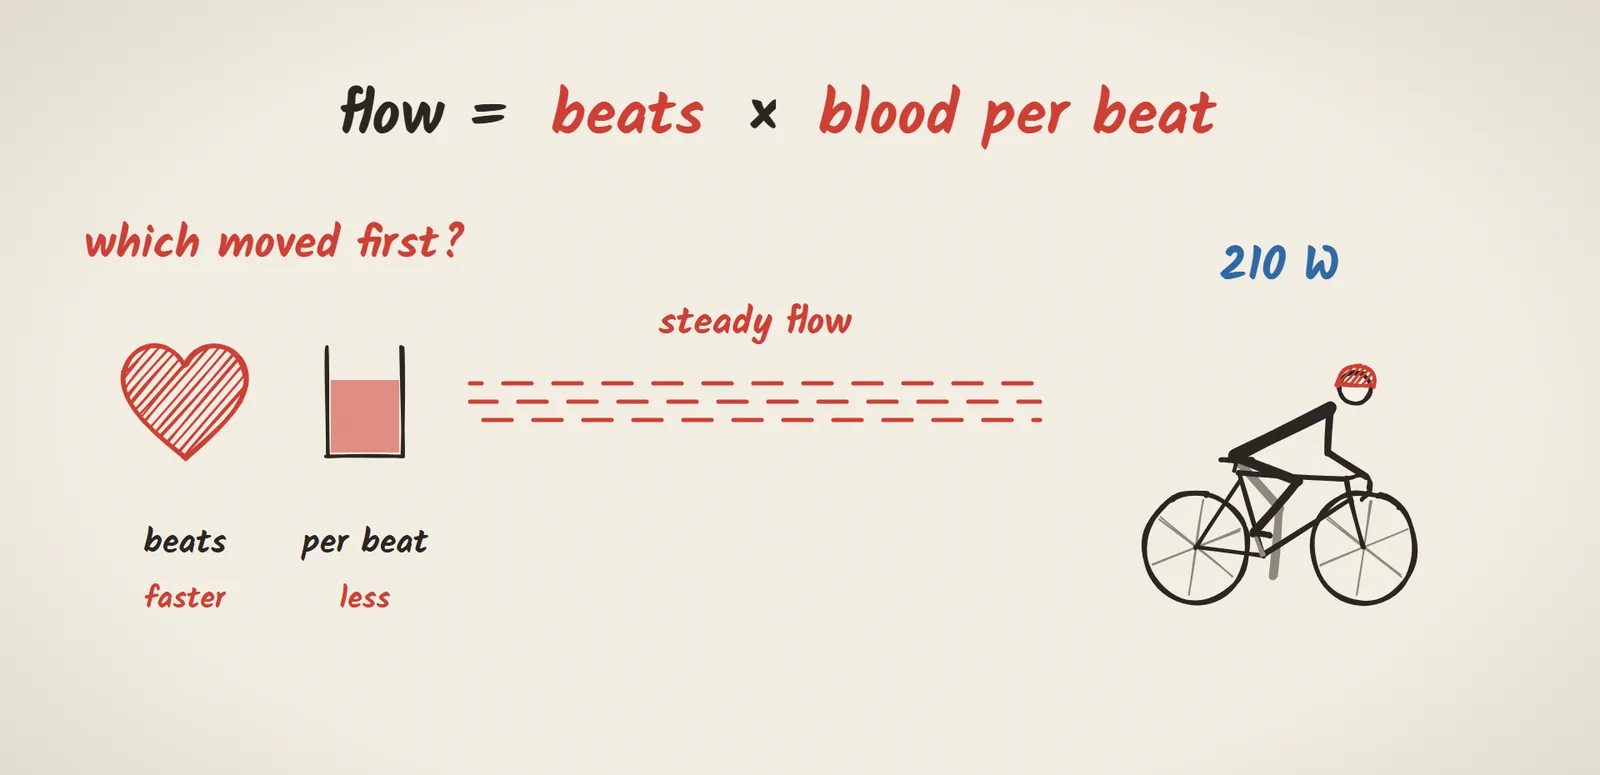
Flow = beats × blood per beat
Start with what has to stay the same. Your legs at 210 W need a steady flow of blood every minute, and that flow is two numbers multiplied together: how often your heart beats, and how much blood it pushes out with each beat. So if the beats go up while the flow holds, each beat must be carrying less. The real question is which of the two moved first.
The textbook story
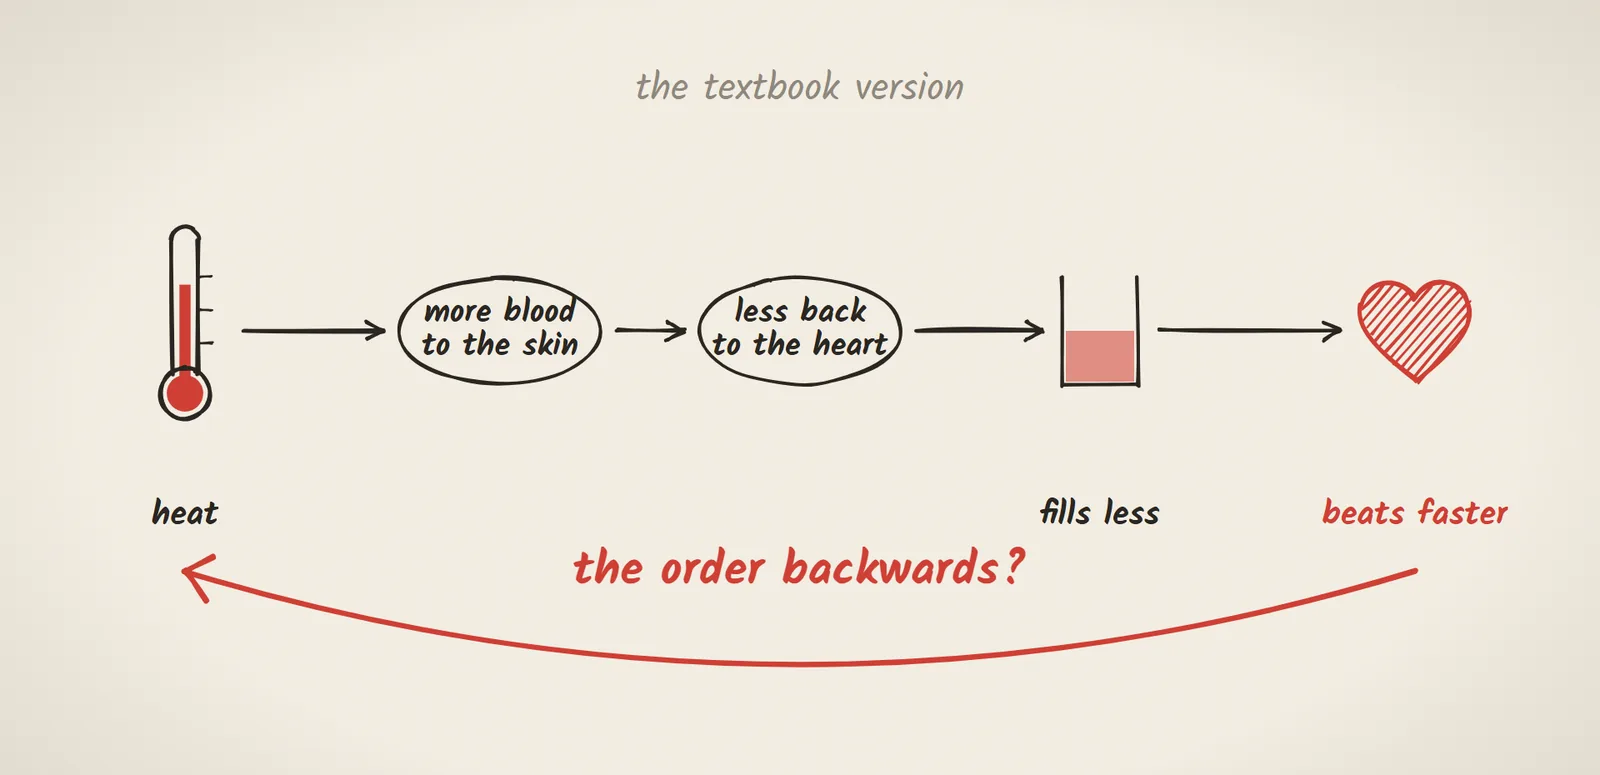
The textbook answer starts with the blood. As you heat up, your body sends more of it to the skin to shed heat, less comes back to the heart, so the heart fills less, each beat carries less, and the heart beats faster to make up the difference. It’s tidy, and every part of it is real. It may also have the order backwards.
Heat, heart rate, filling time
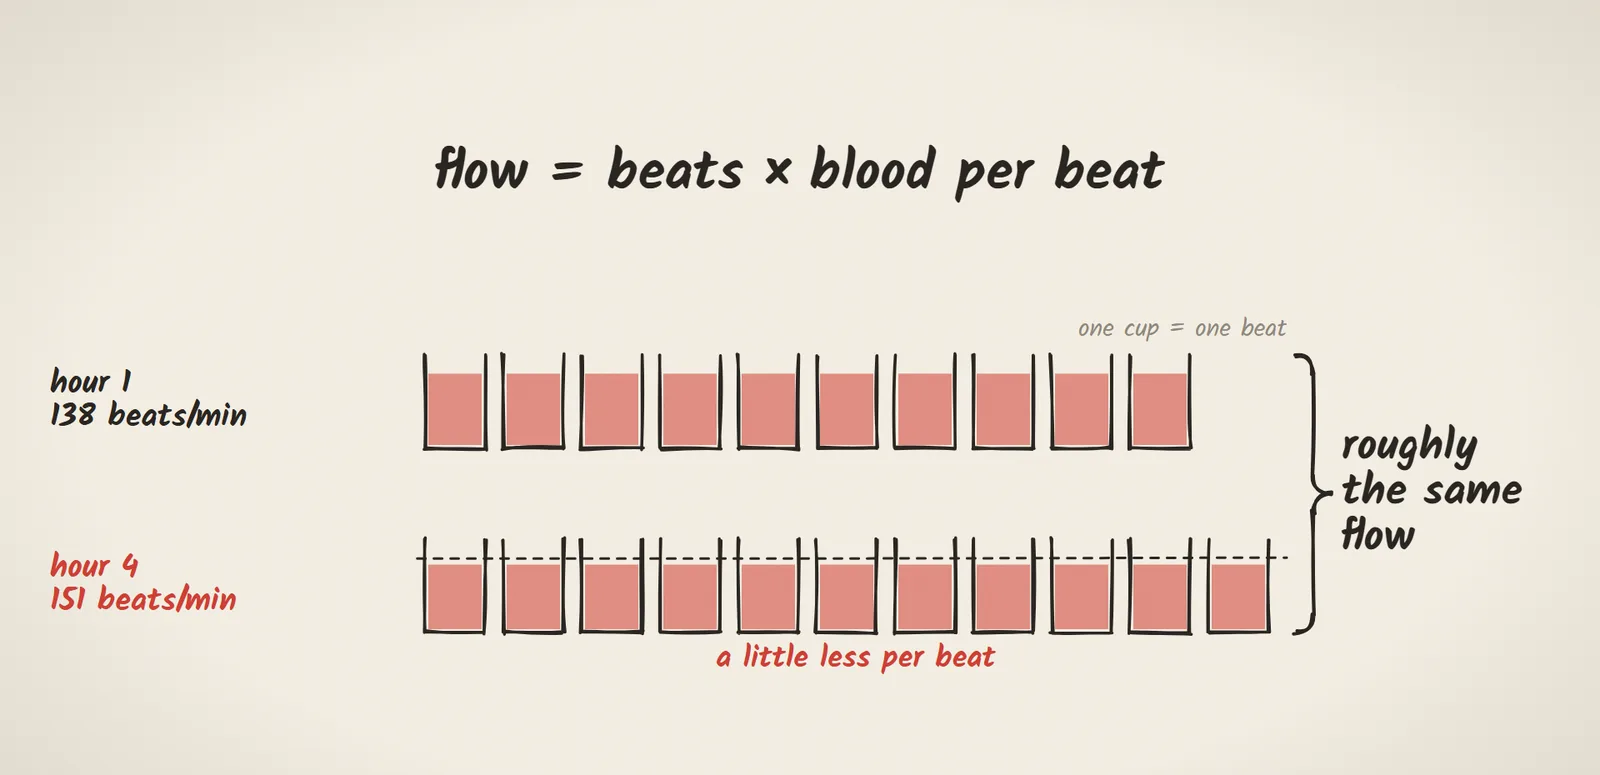
The other version starts with the heart. As your core temperature climbs, your nervous system nudges your heart rate up. A faster heart has less time to fill between beats, so each beat carries a little less blood. Your muscles get roughly the same flow as before, delivered as more beats with less blood in each. Heat is still the cause. What changes is the middle of the chain.
The experiment
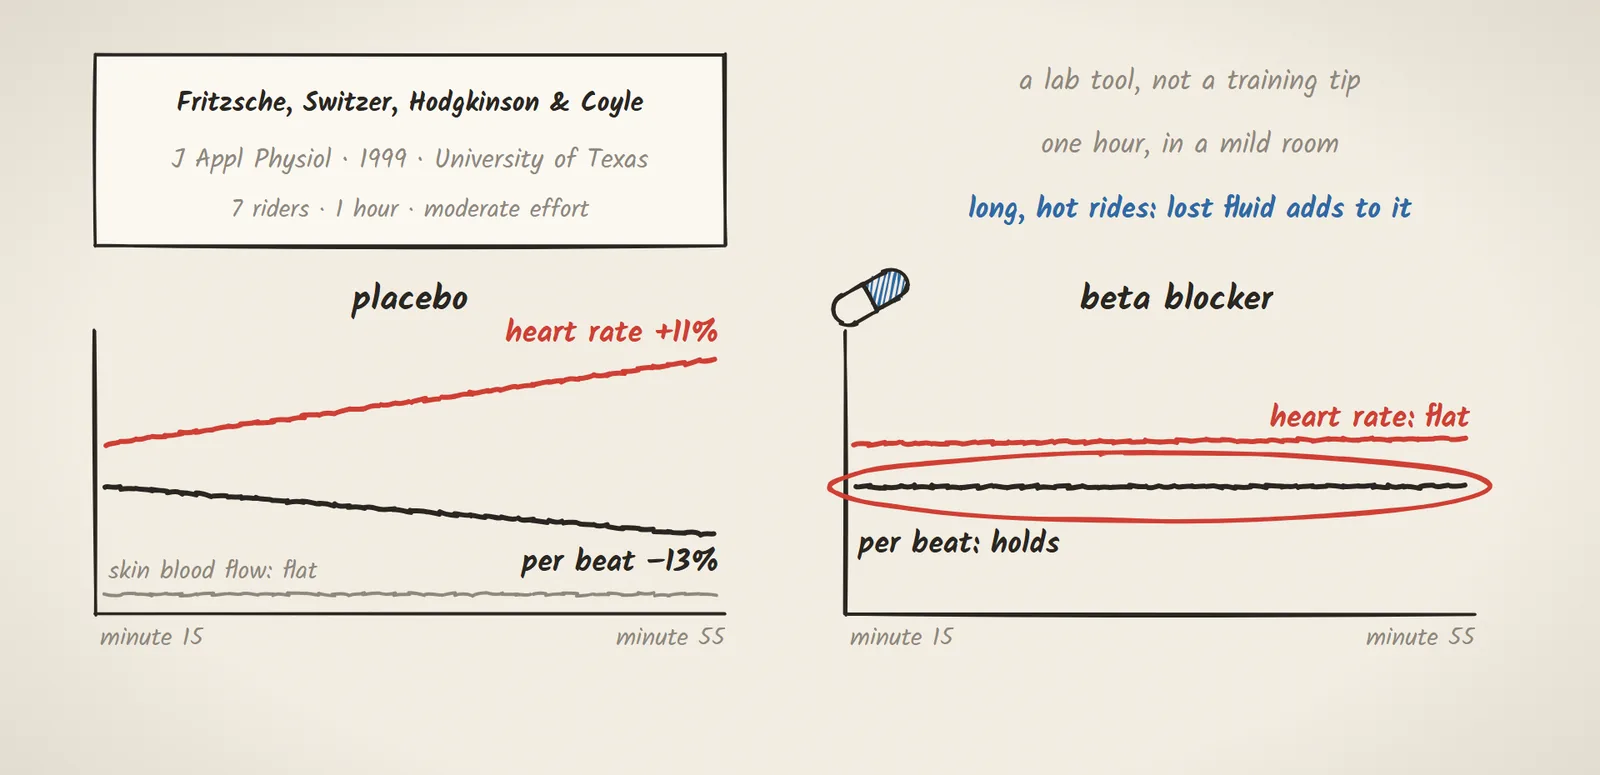
So how do you tell which came first? In 1999, Ed Coyle’s lab at the University of Texas had seven riders pedal for an hour at a steady, moderate effort in a comfortable room. Between minute 15 and minute 55, their heart rate rose 11% and the blood pumped per beat fell 13%, while blood flow to the skin had already levelled off.
On another day, the same riders took a small dose of a beta blocker, a drug that stops the heart rate from climbing. A lab tool, not a training tip. Their heart rate stayed flat, and the drop in blood per beat disappeared with it. Stop the heart speeding up, and it keeps filling. That was one hour in mild conditions, and on a long, hot ride, losing fluid adds a second push in the same direction.
What it means for you
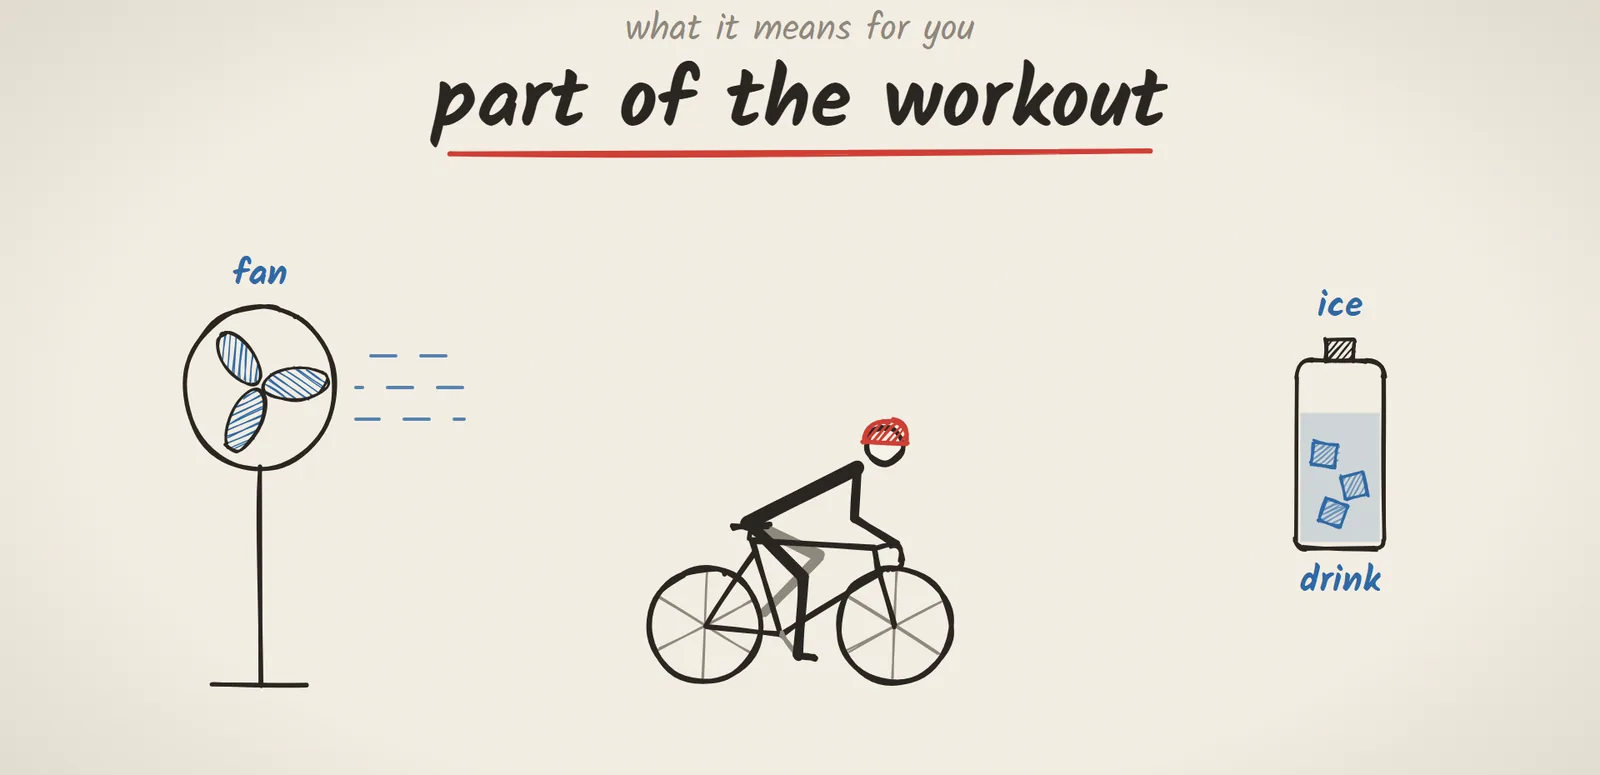
So what does this mean for you? First, a heart rate that climbs inside one ride isn’t your fitness slipping away. It’s mostly heat, plus whatever fluid you haven’t replaced. That makes a fan, ice in your bottle, or simply drinking enough part of the workout, not just a comfort. On a hot indoor ride, airflow is doing real work.
Fitness shows up over weeks
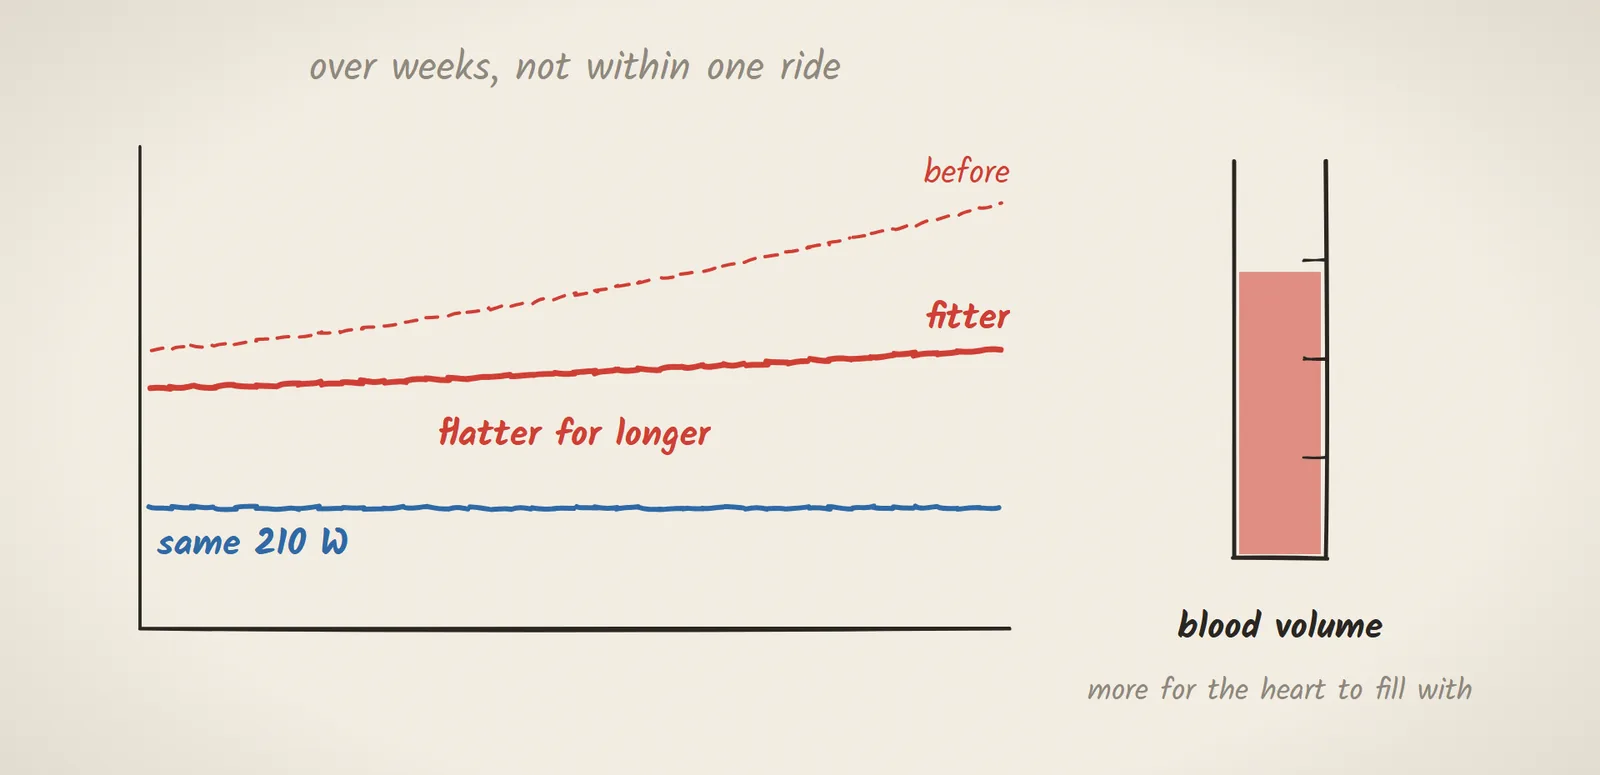
Second, fitness does show up in drift, just over weeks rather than within a ride. As you get fitter, the same 210 W becomes a more comfortable share of what you can sustain, and training expands your blood volume, so the heart has more to fill with. Hold that power, and your heart rate stays flatter for longer.
Compare like with like
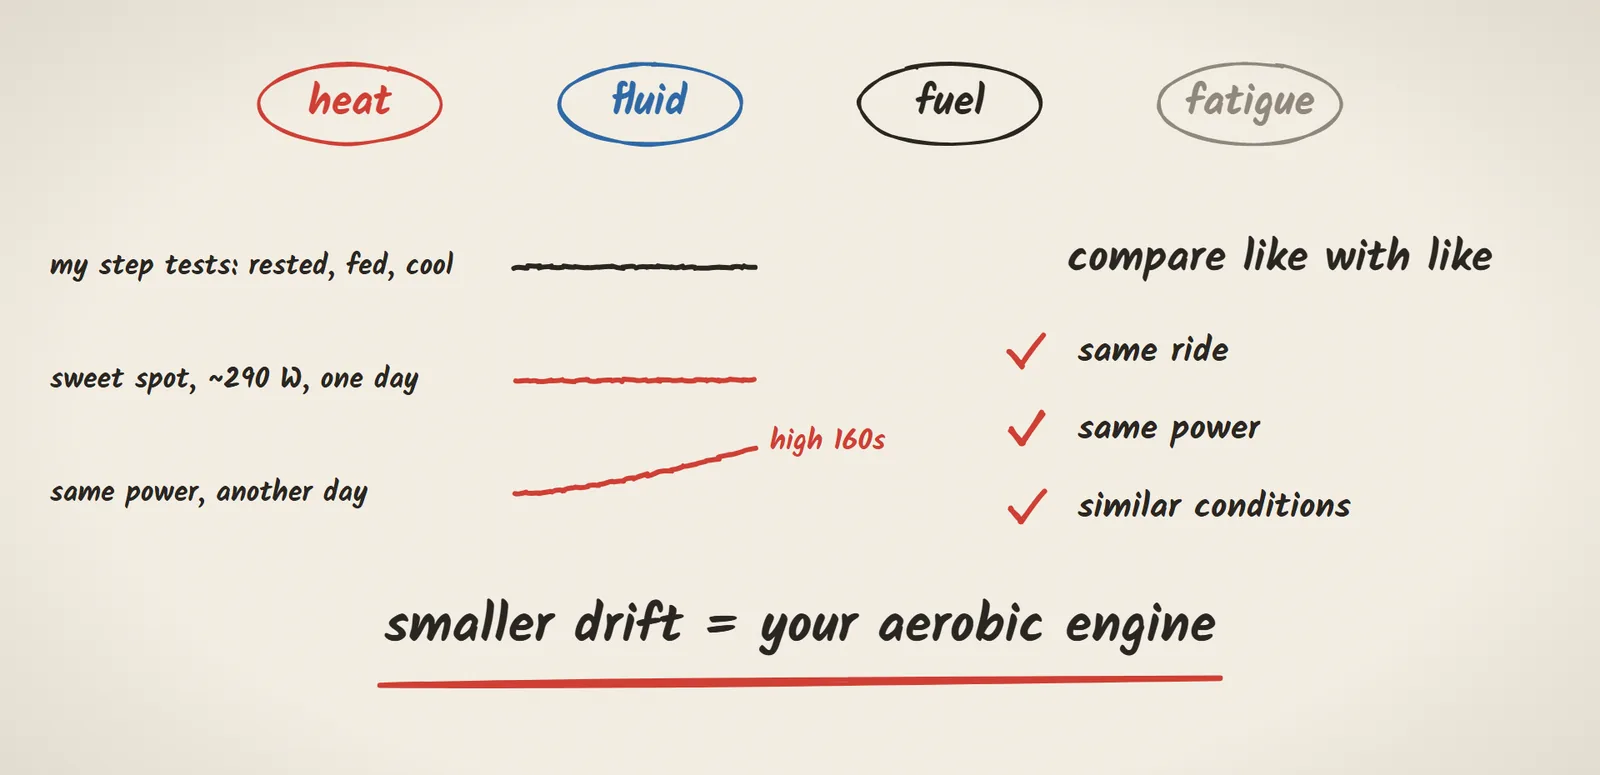
The catch is that the number carries everything else too: heat, fluid, how well you’ve fuelled, and how tired you already are. In my own long step tests, fairly high powers held almost flat when I was rested, fed and cool. And I’ve had sweet spot days where around 290 W sat calmly, and others where my heart rate climbed into the high 160s at the same power. So compare like with like: the same ride, at the same power, in similar conditions. Then a smaller drift really is your aerobic engine.
That’s what’s underneath the watts.
Sources
The study
- Fritzsche RG, Switzer TW, Hodgkinson BJ, Coyle EF. Stroke volume decline during prolonged exercise is influenced by the increase in heart rate. J Appl Physiol. 1999;86(3):799-805. doi.org/10.1152/jappl.1999.86.3.799
Also in this article
- Coyle EF, González-Alonso J. Cardiovascular drift during prolonged exercise: new perspectives. Exerc Sport Sci Rev. 2001;29(2):88-92. doi.org/10.1097/00003677-200104000-00009
Written and researched by Yarin Podoler, a cyclist who wanted to know what’s underneath the watts.